To gain an edge, this is what you need to know today.
Remember 1996 Stock Market
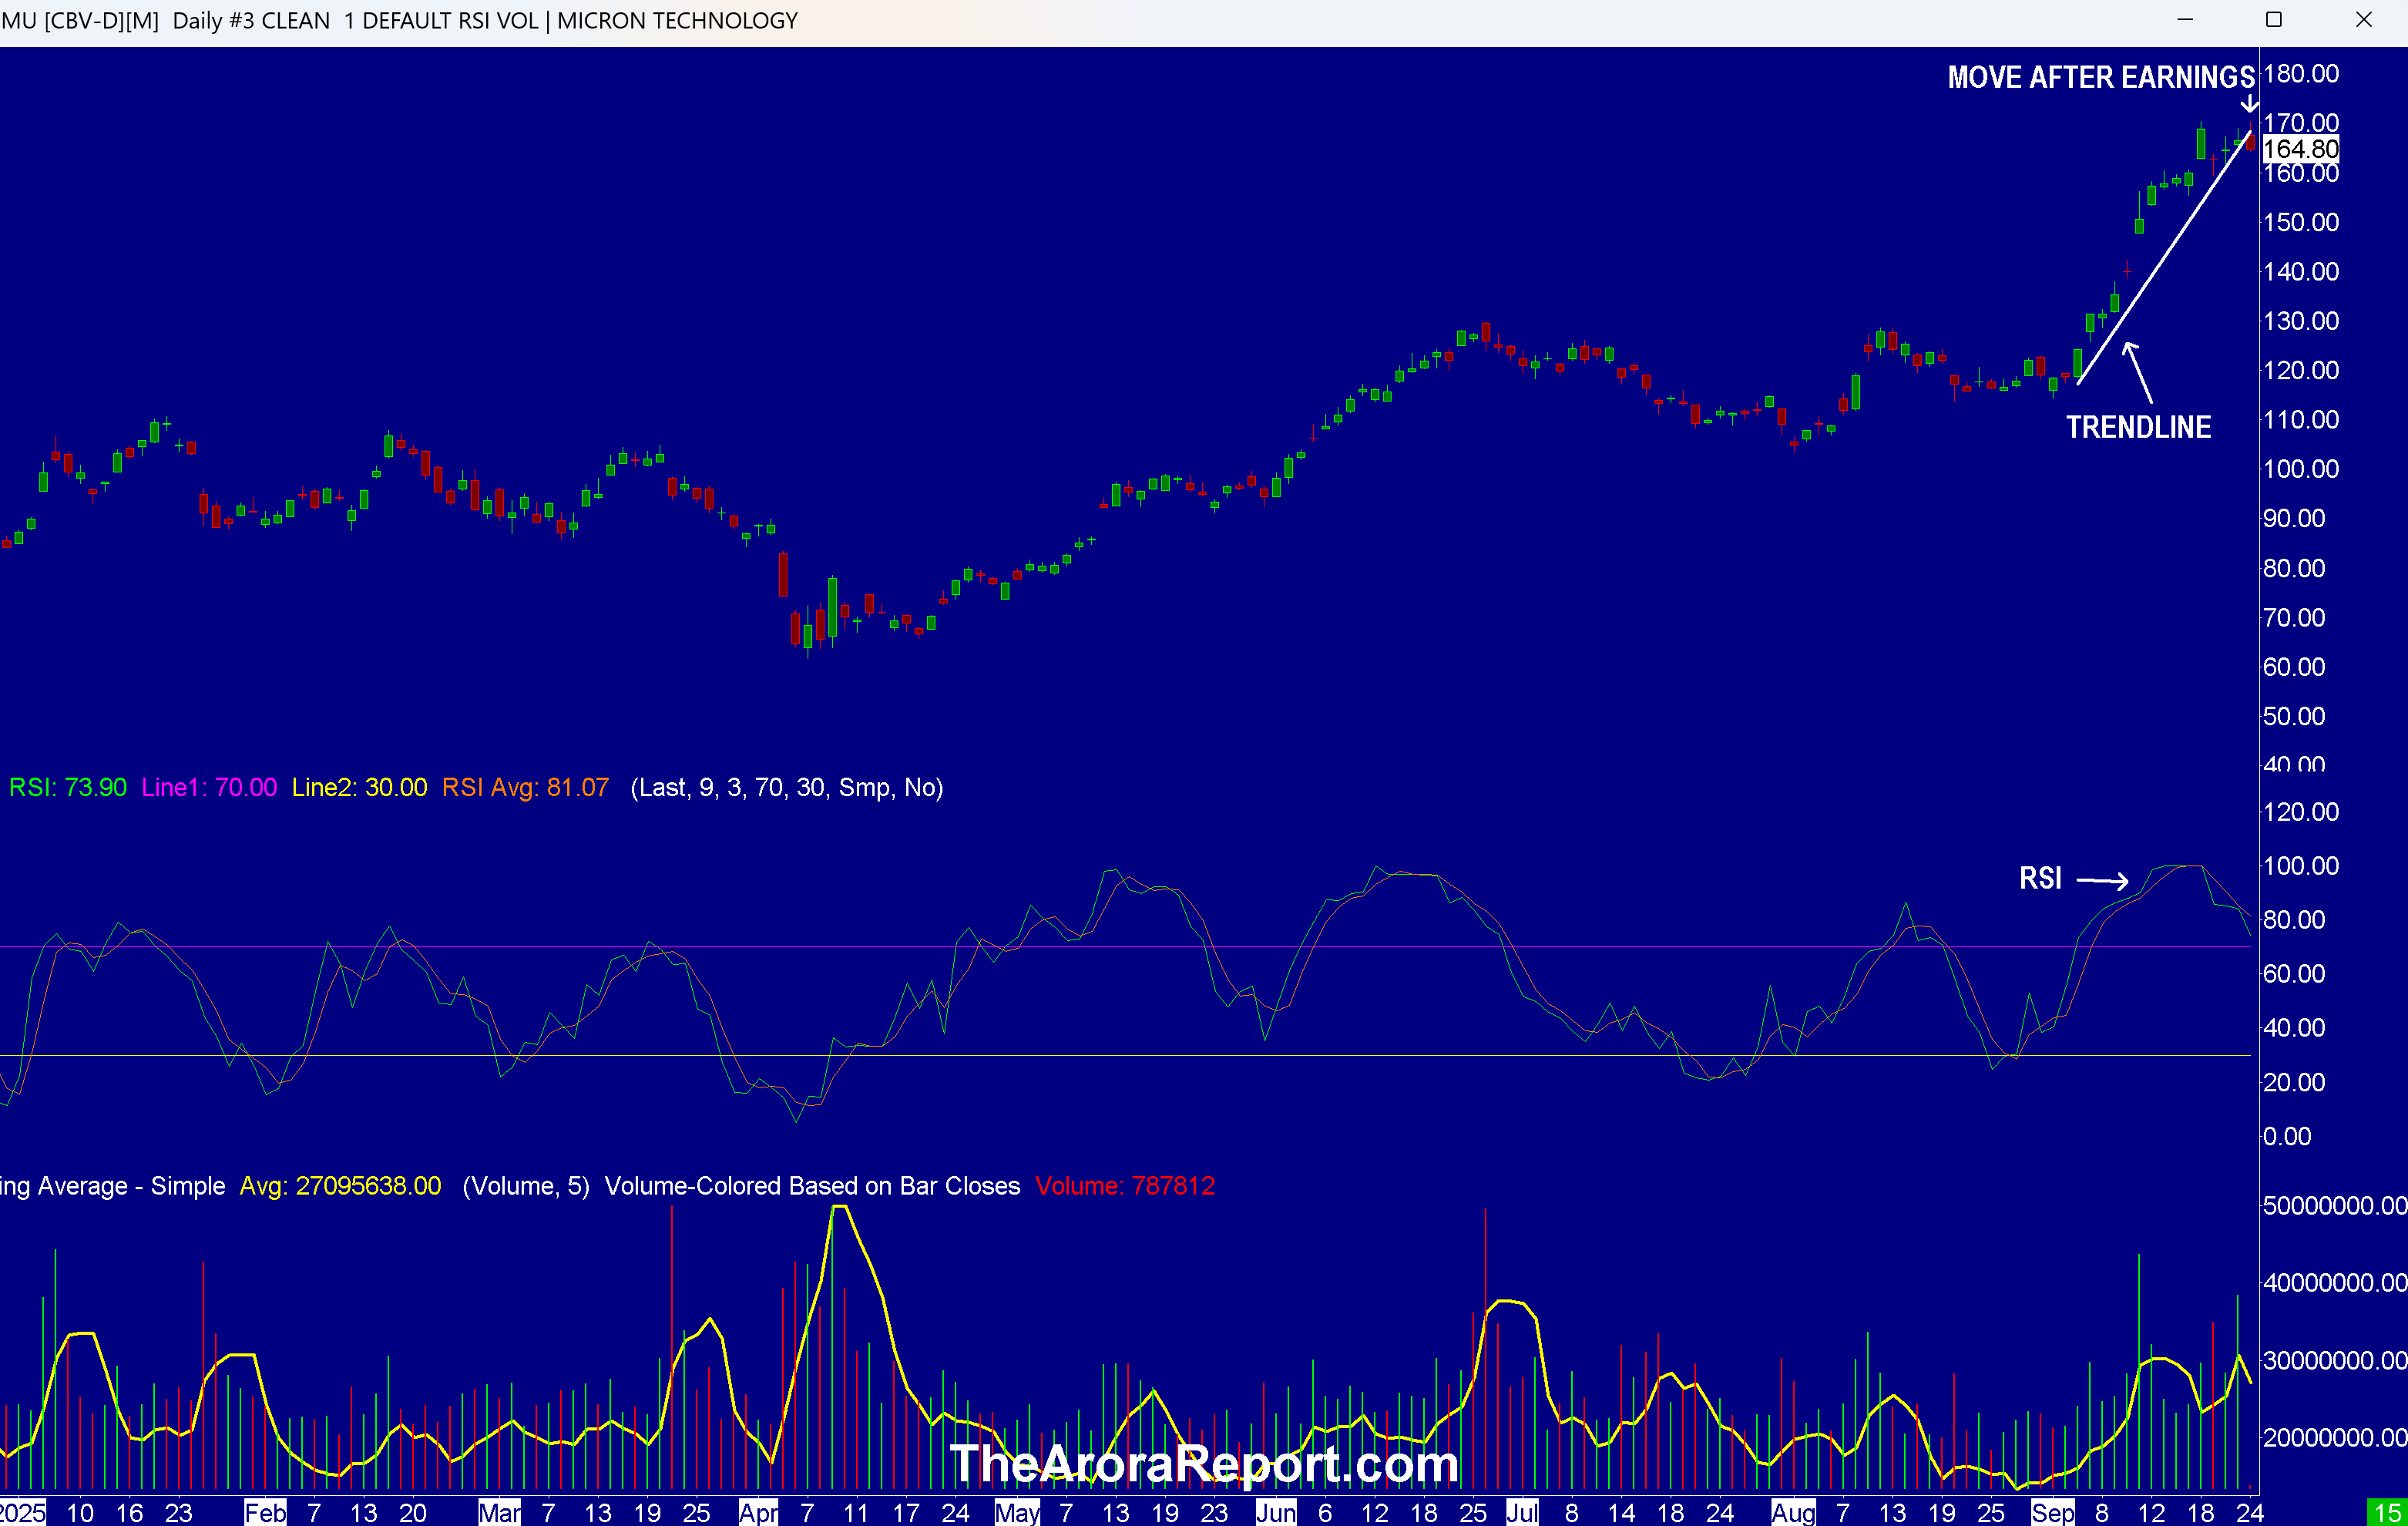
Please click here for an enlarged chart of Micron Technology Inc (NASDAQ:MU).
Note the following:
- This article is about the big picture, not an individual stock. The chart of MU stock is being used to illustrate the point.
- The chart shows yesterday's price action in MU stock was on higher volume.
- Yesterday, we shared with you MU stock was overbought and overbought stocks are susceptible to a pullback.
- The chart shows MU stock is down after reporting excellent earnings. Earnings and projections were better than the consensus and whisper numbers.
- The chart shows MU stock has broken below the trendline.
- Immediately after the release of Micron earnings, the momo crowd bought MU stock extremely aggressively, running MU stock as high as $174.92.
- The chart shows that as of this writing MU stock has pulled back to $164.80, about $10 off from its after hours peak immediately after the earnings release.
- In our analysis, the price action on the MU chart shows that the reason the stock fell even after reporting stellar earnings is that MU stock had pulled forward the good news.
- In our analysis, prudent investors should be aware that almost all of the top performing stocks have pulled forward the potential future good news.
- The MU chart provides good context for Fed Chair Powell's statement yesterday in which he warned that stocks appear to be ‘fairly highly valued'.
- Smart money sold after Fed Chair Powell's warning. Can you guess what the momo crowd did when stocks dipped? You guessed right – the momo crowd aggressively bought the dip.
- In the Interim Capsule, our call was:
Consider trimming some tactical positions, booking partial profits, and moving higher in the protection band based on personal preference and risk appetite. Consider holding strategic positions.
- To understand Fed Chair Powell's warning, prudent investors need to remember December 5, 1996. On that day, then Fed Chairman Alan Greenspan made his famous ‘irrational exuberance' speech. Greenspan said, "But how do we know when irrational exuberance has unduly escalated asset values, which then become subject to unexpected and prolonged contractions as they have in Japan over the past decade?"
- To put it in the proper context, Nikkei 225 in Japan hit its all time high of 38,915.87 on December 29, 1989. Nikkei 225 closed at 20,943.90 on the day of Greenspan's irrational exuberance speech, a 46.2% drop from its peak. Stocks in Japan continued to fall with Nikkei 225 reaching 7054.98 on March 10, 2009, 81.9% off its 1989 peak. Coincidentally, only one day before, on March 9, 2009, when almost everyone on Wall Street was saying to sell stocks, We gave the famous ‘back up the truck' and buy stocks signal. At that time, it was a very bold call. Now we know that March 9, 2009 was the exact bottom in U.S. stocks, and an epic bull market followed. As full disclosure, there is a nicely profitable position in iShares MSCI Japan ETF (NYSE:EWJ) for us.
- Investors need to remember that after Greenspan's warning, the momo crowd continued to aggressively buy stocks, inflating the dot com bubble, and finally the stock market crashed in 2000.
- In our analysis, the probability is fairly high that history may repeat itself again.
- Yesterday we shared with you the breakthrough in quantum computing. This morning, aggressive buying in quantum computing stocks such as IONQ Inc (NYSE:IONQ), Rigetti Computing Inc (NASDAQ:RGTI), Quantum Computing Inc (NASDAQ:QUBT), and D-Wave Quantum Inc (NYSE:QBTS) continues.
- We previously shared with you the extreme exuberance among investors for nuclear stocks. The extreme exuberance in nuclear stocks such as Oklo Inc (NYSE:OKLO), Nuscale Power Corp (NYSE:SMR), Nano Nuclear Energy Inc (NASDAQ:NNE), and Cameco Corp (NYSE:CCJ) continues.
Magnificent Seven Money Flows
Most portfolios are now heavily concentrated in the Mag 7 stocks. For this reason, to get ahead and get an edge, investors need to dig below the surface of the Mag 7 stocks. It is equally important to rise above the noise of daily news on the Mag 7 stocks. The best way to get an edge, dig below the surface, and rise above the noise of the daily news is to pay attention to early money flows in the Mag 7 stocks on a daily basis. When there is significant news in the Mag 7 stocks that rises above the threshold of noise and impacts your entire portfolio, it is covered in the main section above.
In the early trade, money flows are positive in Apple Inc (NASDAQ:AAPL), Amazon.com, Inc. (NASDAQ:AMZN), Meta Platforms Inc (NASDAQ:META), Microsoft Corp (NASDAQ:MSFT), NVIDIA Corp (NASDAQ:NVDA), and Tesla Inc (NASDAQ:TSLA).
In the early trade, money flows are neutral in Alphabet Inc Class C (NASDAQ:GOOG).
In the early trade, money flows are positive in SPDR S&P 500 ETF Trust (NYSE:SPY) and Invesco QQQ Trust Series 1 (NASDAQ:QQQ).
Momo Crowd And Smart Money In Stocks
Investors can gain an edge by knowing money flows in SPY and QQQ. Investors can get a bigger edge by knowing when smart money is buying stocks, gold, and oil. The most popular ETF for gold is SPDR Gold Trust (GLD). The most popular ETF for silver is iShares Silver Trust (SLV). The most popular ETF for oil is United States Oil ETF (USO).
Oil
API crude inventories came at a draw of 3.821M barrels vs. a prior draw of 3.420M barrels.
Oil is moving up on President Trump changing his stance on Ukraine.
Bitcoin
Bitcoin (CRYPTO: BTC) is range bound.
What To Do Now
Consider continuing to hold good, very long term, existing positions. Based on individual risk preference, consider a protection band consisting of cash or Treasury bills or short-term tactical trades as well as short to medium term hedges and short term hedges. This is a good way to protect yourself and participate in the upside at the same time.
You can determine your protection bands by adding cash to hedges. The high band of the protection is appropriate for those who are older or conservative. The low band of the protection is appropriate for those who are younger or aggressive. If you do not hedge, the total cash level should be more than stated above but significantly less than cash plus hedges.
A protection band of 0% would be very bullish and would indicate full investment with 0% in cash. A protection band of 100% would be very bearish and would indicate a need for aggressive protection with cash and hedges or aggressive short selling.
It is worth reminding that you cannot take advantage of new upcoming opportunities if you are not holding enough cash. When adjusting hedge levels, consider adjusting partial stop quantities for stock positions (non ETF); consider using wider stops on remaining quantities and also allowing more room for high beta stocks. High beta stocks are the ones that move more than the market.
Traditional 60/40 Portfolio
Probability based risk reward adjusted for inflation does not favor long duration strategic bond allocation at this time.
Those who want to stick to traditional 60% allocation to stocks and 40% to bonds may consider focusing on only high quality bonds and bonds of five year duration or less. Those willing to bring sophistication to their investing may consider using bond ETFs as tactical positions and not strategic positions at this time.
**
The Arora Report is known for its accurate calls. The Arora Report correctly called the big artificial intelligence rally before anyone else, the new bull market of 2023, the bear market of 2022, new stock market highs right after the virus low in 2020, the virus drop in 2020, the DJIA rally to 30,000 when it was trading at 16,000, the start of a mega bull market in 2009, and the financial crash of 2008. Please click here to sign up for a free forever Generate Wealth Newsletter.
**
Benzinga Disclaimer: This article is from an unpaid external contributor. It does not represent Benzinga’s reporting and has not been edited for content or accuracy.
- No comments yet. Be the first to comment!