Braze Inc. (NASDAQ:BRZE) climbed 23.36% to $22.23 in pre-market trading on Wednesday after the company released its fiscal fourth-quarter 2026 results.
The stock of the cloud-based customer engagement platform closed the regular session 4.76% lower at $18.02, according to Benzinga Pro data.
What Do The Q4 Results Say?
Braze reported the following results compared with the same quarter a year earlier:
| Metric | Q4 FY2026 | Q4 FY2025 |
|---|---|---|
| Revenue | $205.2M | $160.4M |
| Non-GAAP Operating Income | $14.5M | $7.9M |
| Total Customers | 2,609 | 2,296 |
| Free Cash Flow | $13.9M | $15.2M |
Braze's fourth-quarter revenue rose 27.9% year over year.
Customers with annual recurring revenue of $500,000 or more increased to 333 from 247 and quarterly bookings grew more than 50% from the same period a year earlier.
“The world’s largest and most sophisticated brands are choosing Braze as a foundational partner,” said CEO Bill Magnuson.
Full-Year FY2026 Results
Full-year revenue for Braze totaled $738.2 million, up 24.4% from a year earlier.
Non-GAAP operating income reached $28.5 million, compared with breakeven in fiscal 2025.
Free cash flow for the company increased to $58.1 million from $19.6 million.
Repurchase Program, Financial Outlook
Braze’s Board approved a $100 million share repurchase program. The company plans to imminently enter into an accelerated share repurchase transaction of approximately $50 million of its outstanding Class A Common Stock.
Braze provided the following guidance for the first quarter and full year of fiscal 2027:
| Metric | Q1 FY2027 | FY2027 |
|---|---|---|
| Revenue | $204.5M – $205.5M | $884.0M – $889.0M |
| Non-GAAP Operating Income | $10.0M – $11.0M | $69.0M – $73.0M |
| Non-GAAP Net Income | $11.0M – $12.0M | $69.0M – $73.0M |
| Non-GAAP EPS (Diluted) | $0.10 – $0.11 | $0.61 – $0.65 |
| Wtd. Avg. Shares (Diluted) | ~112.0M | ~113.0M |
Trading Metrics, Technical Analysis
Braze Inc. has a market capitalization of $2.03 billion and a 52-week trading range of $43.89 to $15.26.
It has a Relative Strength Index (RSI) of 41.76.
BRZE has dropped 53.96% over the past 12 months, underscoring challenges for its longer-term outlook.
The small-cap stock is currently positioned at about 9.65% of its 52-week range from the bottom, just above its annual low.
Benzinga's Edge Stock Rankings indicate that BRZE has a negative price trend across all time frames.
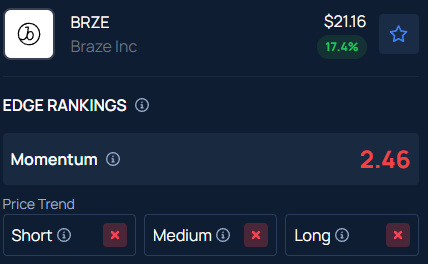
Photo courtesy: FabrikaSimf on Shutterstock.com
Disclaimer: This content was partially produced with the help of AI tools and was reviewed and published by Benzinga editors.
Login to comment