In a world of doomscrolling and binge-watching the news, the words “chaos” and “unstable” may come to mind.
But when you take a step back (and a deep breath), the data tells a different story.
In fact, a seasonal pattern is forming that you won’t hear about on TV.
And it’s happened with nearly 100% precision over the last 10 years alone between now and late June.
Here’s my April trader’s forecast, and the two ETFs to buy.

As you can see, my pattern tracker has nothing but green on the screen. The number of bullish patterns on stocks and exchange-traded funds (ETFs) clearly outweighs the number of bearish ones.
But when I ran my scans and dug into the numbers, here’s what I found: The markets drift lower into late March, investors get nervous, and right as April starts, they bottom out.
Then, we see a BIG run up through the middle to end of June.
Now I’m not saying history has to repeat exactly.
But everything I’m looking at shows the same type of alignment. And it starts with these two exchange-traded funds (ETFs):
1. Invesco QQQ Trust (NASDAQ:QQQ)
If there’s one chart leading this setup right now, it’s the QQQ.
This ETF tracks the Nasdaq-100, which means it’s heavily weighted toward the biggest names in tech and growth (think Apple, Microsoft, and Nvidia). That matters because it’s where the money shows up first—and moves the fastest.
It’s also where I’m seeing the strongest combination of:
- Seasonality
- Structure
- And probability
We’ve already seen the pullback. We’ve already seen the stabilization:

And historically, we’re moving into what has been one of the strongest windows of the year for the Nasdaq 100, right through April and into May:
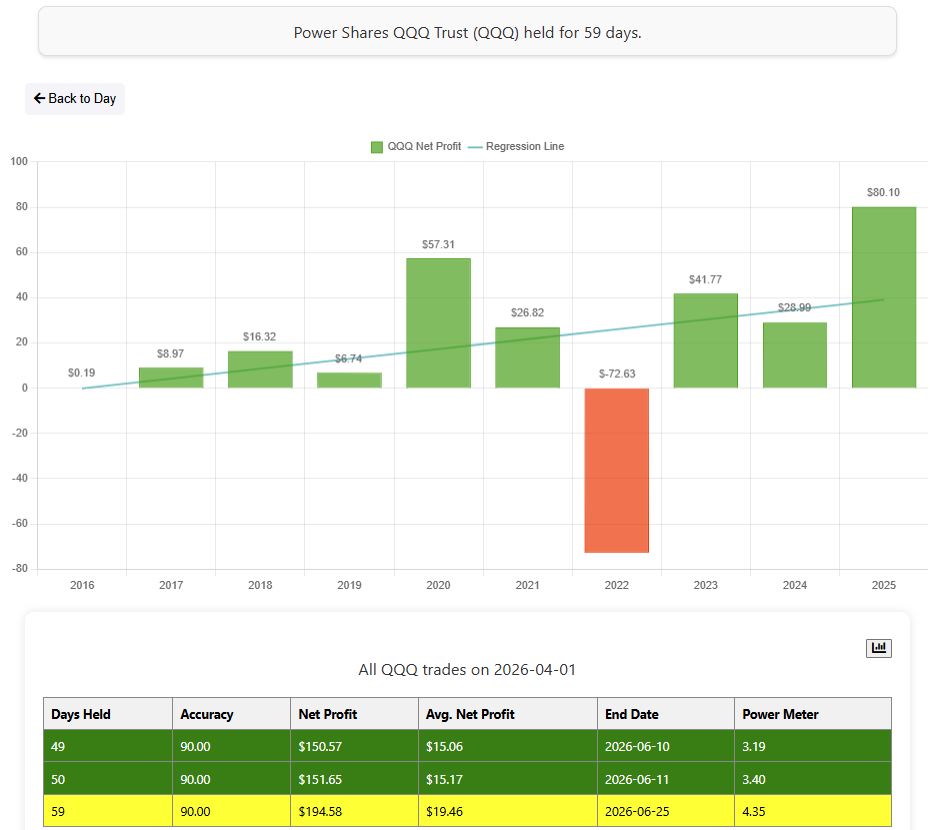
Over the past 10 years alone, QQQ has climbed 90% of the time (with 2022 as the outlier year)—and generated an average net profit of $194.58 for traders who took advantage of the move.
Plan Trades Around Catalysts Weeks in Advance
Earnings dates, FDA approvals, economic releases, and analyst changes all in one calendar. Position before events, not after everyone else reacts. Start Your 14-Day Free Trial
2. State Street SPDR S&P 500 ETF Trust (NYSE:SPY)
I’m also watching SPY, not because it’s stronger, but because it reinforces the overall bullish pattern forming now.
The SPY tracks the S&P 500, giving you broad exposure to the entire U.S. market. And it’s not just tech—it’s everything: financials, healthcare, industrials. So, when you want to understand what the overall market is doing, this ETF is your benchmark.
And SPY is showing the exact same seasonal strength from now through June:

There’s a little less momentum than QQQ, but that’s normal. SPY is broader and moves more slowly.
What’s important is the pattern itself. And over the last 10 years, SPY has also rallied in nine of the last 10 years—handing traders in the know an average net profit of $156.22:

So when both QQQ and SPY start to align the same way they have over the past decade, that tells you it’s not just an interesting coincidence, it’s a major market shift.
And it’s one that’s worth watching closely.
Image via Shutterstock
Login to comment