Bloom Energy Corp (NYSE:BE) shares are climbing Monday afternoon as traders keep leaning into the company's post-earnings momentum and fresh guidance lift. Here’s what investors need to know.
- Bloom Energy stock is surging to new heights today. Why is BE stock surging?
What Is Driving Bloom Energy’s Stock Surge?
The latest leg higher follows a first-quarter double beat and raised fiscal-year 2026 guidance, after the company posted adjusted EPS of 44 cents versus 13 cents expected and revenue of $751.05 million versus $551.55 million expected. Management tied the revenue jump to a 208% increase in product revenue, and the quarter also included $73.6 million in operating cash flow, up $184.3 million from the prior-year period.
Bloom's execution is also tightening the spotlight on upcoming clean-energy earnings, with Plug Power set to report after the bell and investors watching for $140.31 million in revenue and a 10-cent loss versus a 21-cent loss a year ago. Plug Power’s movement could also provide a benchmark for Bloom Energy because the group often trades as a risk-on/risk-off basket, but Bloom's 130% year-over-year revenue growth and 208% product-revenue surge set a higher hurdle for peers to justify similar multiple expansion.
Critical Price Levels To Watch For BE
Bloom is pressing the upper end of its 52-week range, with price sitting just below the $302.99 high, which keeps the primary trend pointed up but also raises the odds of quick profit-taking near prior peaks. The stock is trading 19.7% above its 20-day SMA ($243.85) and 142% above its 200-day SMA ($120.69), a stretched setup that often needs either consolidation or a sharper pullback to reset.
For momentum, MACD is the cleaner lens right now: it's below its signal line and the histogram is negative, which suggests upside pressure is cooling versus the prior upswing unless buyers can reassert control. In plain terms, when MACD sits below its signal line, it often means the trend is still up, but the "push" behind it is fading.
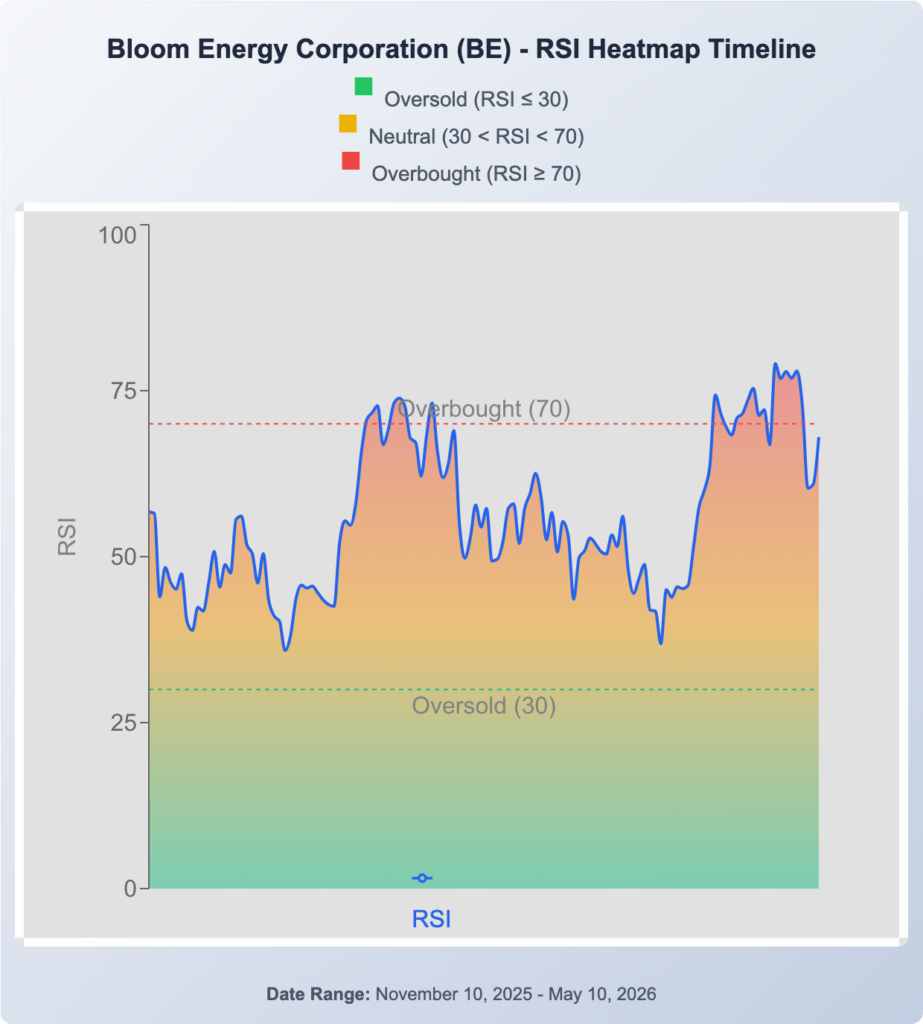
The longer-term structure remains bullish with the 20-day SMA above the 50-day SMA and a golden cross (50-day above 200-day) in June 2025, but the stock's distance from key averages makes it more sensitive to any disappointment. Traders will also note the prior momentum "stretch" reference point—RSI first entered overbought territory in April—which can matter if the stock starts failing to hold breakouts.
- Key Resistance: $303.00 — a nearby round-number area sitting right on top of the 52-week high zone where rallies can stall
Wall Street's View On Bloom Energy
Analyst Consensus & Recent Actions: The stock carries a Buy rating with an average price target of $203.33. Recent analyst moves include:
- Citigroup: Neutral (Raises Target to $281.00) (April 30)
- JP Morgan: Overweight (Raises Target to $267.00) (April 29)
- TD Cowen: Hold (Raises Target to $235.00) (April 29)
Bloom Energy’s Benzinga Edge Scorecard Analysis
Below is the Benzinga Edge scorecard for Bloom Energy, highlighting its strengths and weaknesses compared to the broader market:
- Momentum: Bullish (Score: 99.66) — The stock is showing strong relative strength versus the broader market, consistent with its steep multi-month uptrend.
- Value: Weak (Score: 0.85) — The market is pricing in a lot of future improvement, leaving little margin for error if growth cools.
- Growth: Bullish (Score: 98.6) — The score aligns with the company's rapid top-line expansion and the market's focus on scaling.
The Verdict: Bloom Energy’s Benzinga Edge signal reveals a classic High-Flyer setup—momentum and growth are doing the heavy lifting while value screens as very weak. For longer-term holders, that usually means trend-following can work, but risk management matters more near highs because pullbacks can be fast when expectations are elevated.
Bloom Energy Stock Price Movement Today
BE Stock Price Activity: Bloom Energy shares were up 12.63% at $293.99 at the time of publication on Monday, according to Benzinga Pro data.
Image: Shutterstock
Login to comment