In the ever-evolving and intensely competitive business landscape, conducting a thorough company analysis is of utmost importance for investors and industry followers. In this article, we will carry out an in-depth industry comparison, assessing Microsoft (NASDAQ:MSFT) alongside its primary competitors in the Software industry. By meticulously examining key financial metrics, market positioning, and growth prospects, we aim to offer valuable insights to investors and shed light on company's performance within the industry.
Microsoft Background
Microsoft develops and licenses consumer and enterprise software. It is known for its Windows operating systems and Office productivity suite. The company is organized into three equally sized broad segments: productivity and business processes (legacy Microsoft Office, cloud-based Office 365, Exchange, SharePoint, Skype, LinkedIn, Dynamics), intelligence cloud (infrastructure- and platform-as-a-service offerings Azure, Windows Server OS, SQL Server), and more personal computing (Windows Client, Xbox, Bing search, display advertising, and Surface laptops, tablets, and desktops).
| Company | P/E | P/B | P/S | ROE | EBITDA (in billions) | Gross Profit (in billions) | Revenue Growth |
|---|---|---|---|---|---|---|---|
| Microsoft Corp | 22.89 | 6.89 | 9.01 | 7.89% | $50.28 | $56.06 | 18.3% |
| Oracle Corp | 24.44 | 10.93 | 6.16 | 11.88% | $9.65 | $12.51 | 20.63% |
| Palo Alto Networks Inc | 306.12 | 10.37 | 24.44 | -0.96% | $0.18 | $2.03 | 31.15% |
| Fortinet Inc | 61.62 | 117.69 | 16.91 | 48.0% | $0.7 | $1.49 | 20.13% |
| ServiceNow Inc | 62.98 | 9.30 | 7.92 | 3.8% | $0.94 | $2.83 | 22.09% |
| Nebius Group NV | 88.49 | 8.04 | 69.30 | 10.5% | $0.92 | $0.3 | 683.89% |
| Gen Digital Inc | 16.62 | 6.02 | 3.23 | 20.72% | $0.92 | $1.01 | 27.03% |
| Check Point Software Technologies Ltd | 13.82 | 4.96 | 5.29 | 6.73% | $0.2 | $0.57 | 4.8% |
| BlackBerry Ltd | 128.10 | 10 | 13.15 | 1.14% | $0.02 | $0.12 | 25.64% |
| CommVault Systems Inc | 93.04 | 812.57 | 5.55 | 13.07% | $0.03 | $0.25 | 13.33% |
| UiPath Inc | 19.25 | 3.14 | 3.73 | 1.13% | $0.04 | $0.34 | 17.32% |
| Qualys Inc | 25.76 | 8.87 | 7.58 | 8.96% | $0.06 | $0.15 | 9.84% |
| Dolby Laboratories Inc | 20.87 | 1.90 | 3.73 | 3.64% | $0.14 | $0.35 | 7.05% |
| Monday.Com Ltd | 33.28 | 5.14 | 3.05 | 2.8% | $0.02 | $0.31 | 24.45% |
| Teradata Corp | 7.89 | 5.82 | 1.97 | 85.13% | $0.47 | $0.28 | 6.22% |
| A10 Networks Inc | 62.30 | 12.39 | 9.27 | 5.57% | $0.02 | $0.06 | 13.4% |
| Average | 64.31 | 68.48 | 12.09 | 14.81% | $0.95 | $1.51 | 61.8% |
Through an analysis of Microsoft, we can infer the following trends:
-
The stock's Price to Earnings ratio of 22.89 is lower than the industry average by 0.36x, suggesting potential value in the eyes of market participants.
-
The current Price to Book ratio of 6.89, which is 0.1x the industry average, is substantially lower than the industry average, indicating potential undervaluation.
-
With a relatively low Price to Sales ratio of 9.01, which is 0.75x the industry average, the stock might be considered undervalued based on sales performance.
-
The Return on Equity (ROE) of 7.89% is 6.92% below the industry average, suggesting potential inefficiency in utilizing equity to generate profits.
-
The company has higher Earnings Before Interest, Taxes, Depreciation, and Amortization (EBITDA) of $50.28 Billion, which is 52.93x above the industry average, indicating stronger profitability and robust cash flow generation.
-
The company has higher gross profit of $56.06 Billion, which indicates 37.13x above the industry average, indicating stronger profitability and higher earnings from its core operations.
-
The company is witnessing a substantial decline in revenue growth, with a rate of 18.3% compared to the industry average of 61.8%, which indicates a challenging sales environment.
Debt To Equity Ratio
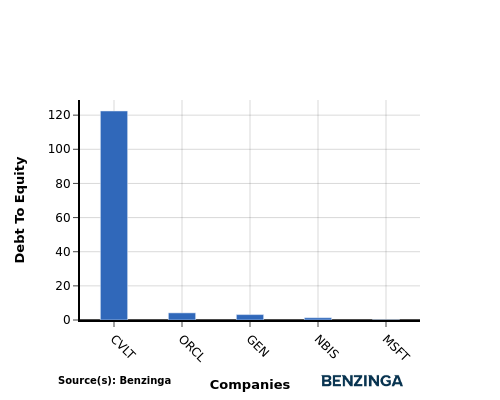
The debt-to-equity (D/E) ratio is a financial metric that helps determine the level of financial risk associated with a company's capital structure.
Considering the debt-to-equity ratio in industry comparisons allows for a concise evaluation of a company's financial health and risk profile, aiding in informed decision-making.
In light of the Debt-to-Equity ratio, a comparison between Microsoft and its top 4 peers reveals the following information:
-
Microsoft demonstrates a stronger financial position compared to its top 4 peers in the sector.
-
With a lower debt-to-equity ratio of 0.14, the company relies less on debt financing and maintains a healthier balance between debt and equity, which can be viewed positively by investors.
Key Takeaways
For Microsoft in the Software industry, the PE, PB, and PS ratios are all low compared to peers, indicating potential undervaluation. However, the low ROE suggests lower profitability relative to industry peers. On the other hand, Microsoft's high EBITDA and gross profit signify strong operational performance. The low revenue growth may be a concern for future prospects compared to industry peers.
This article was generated by Benzinga's automated content engine and reviewed by an editor.
Login to comment