$40 Trillion Debt
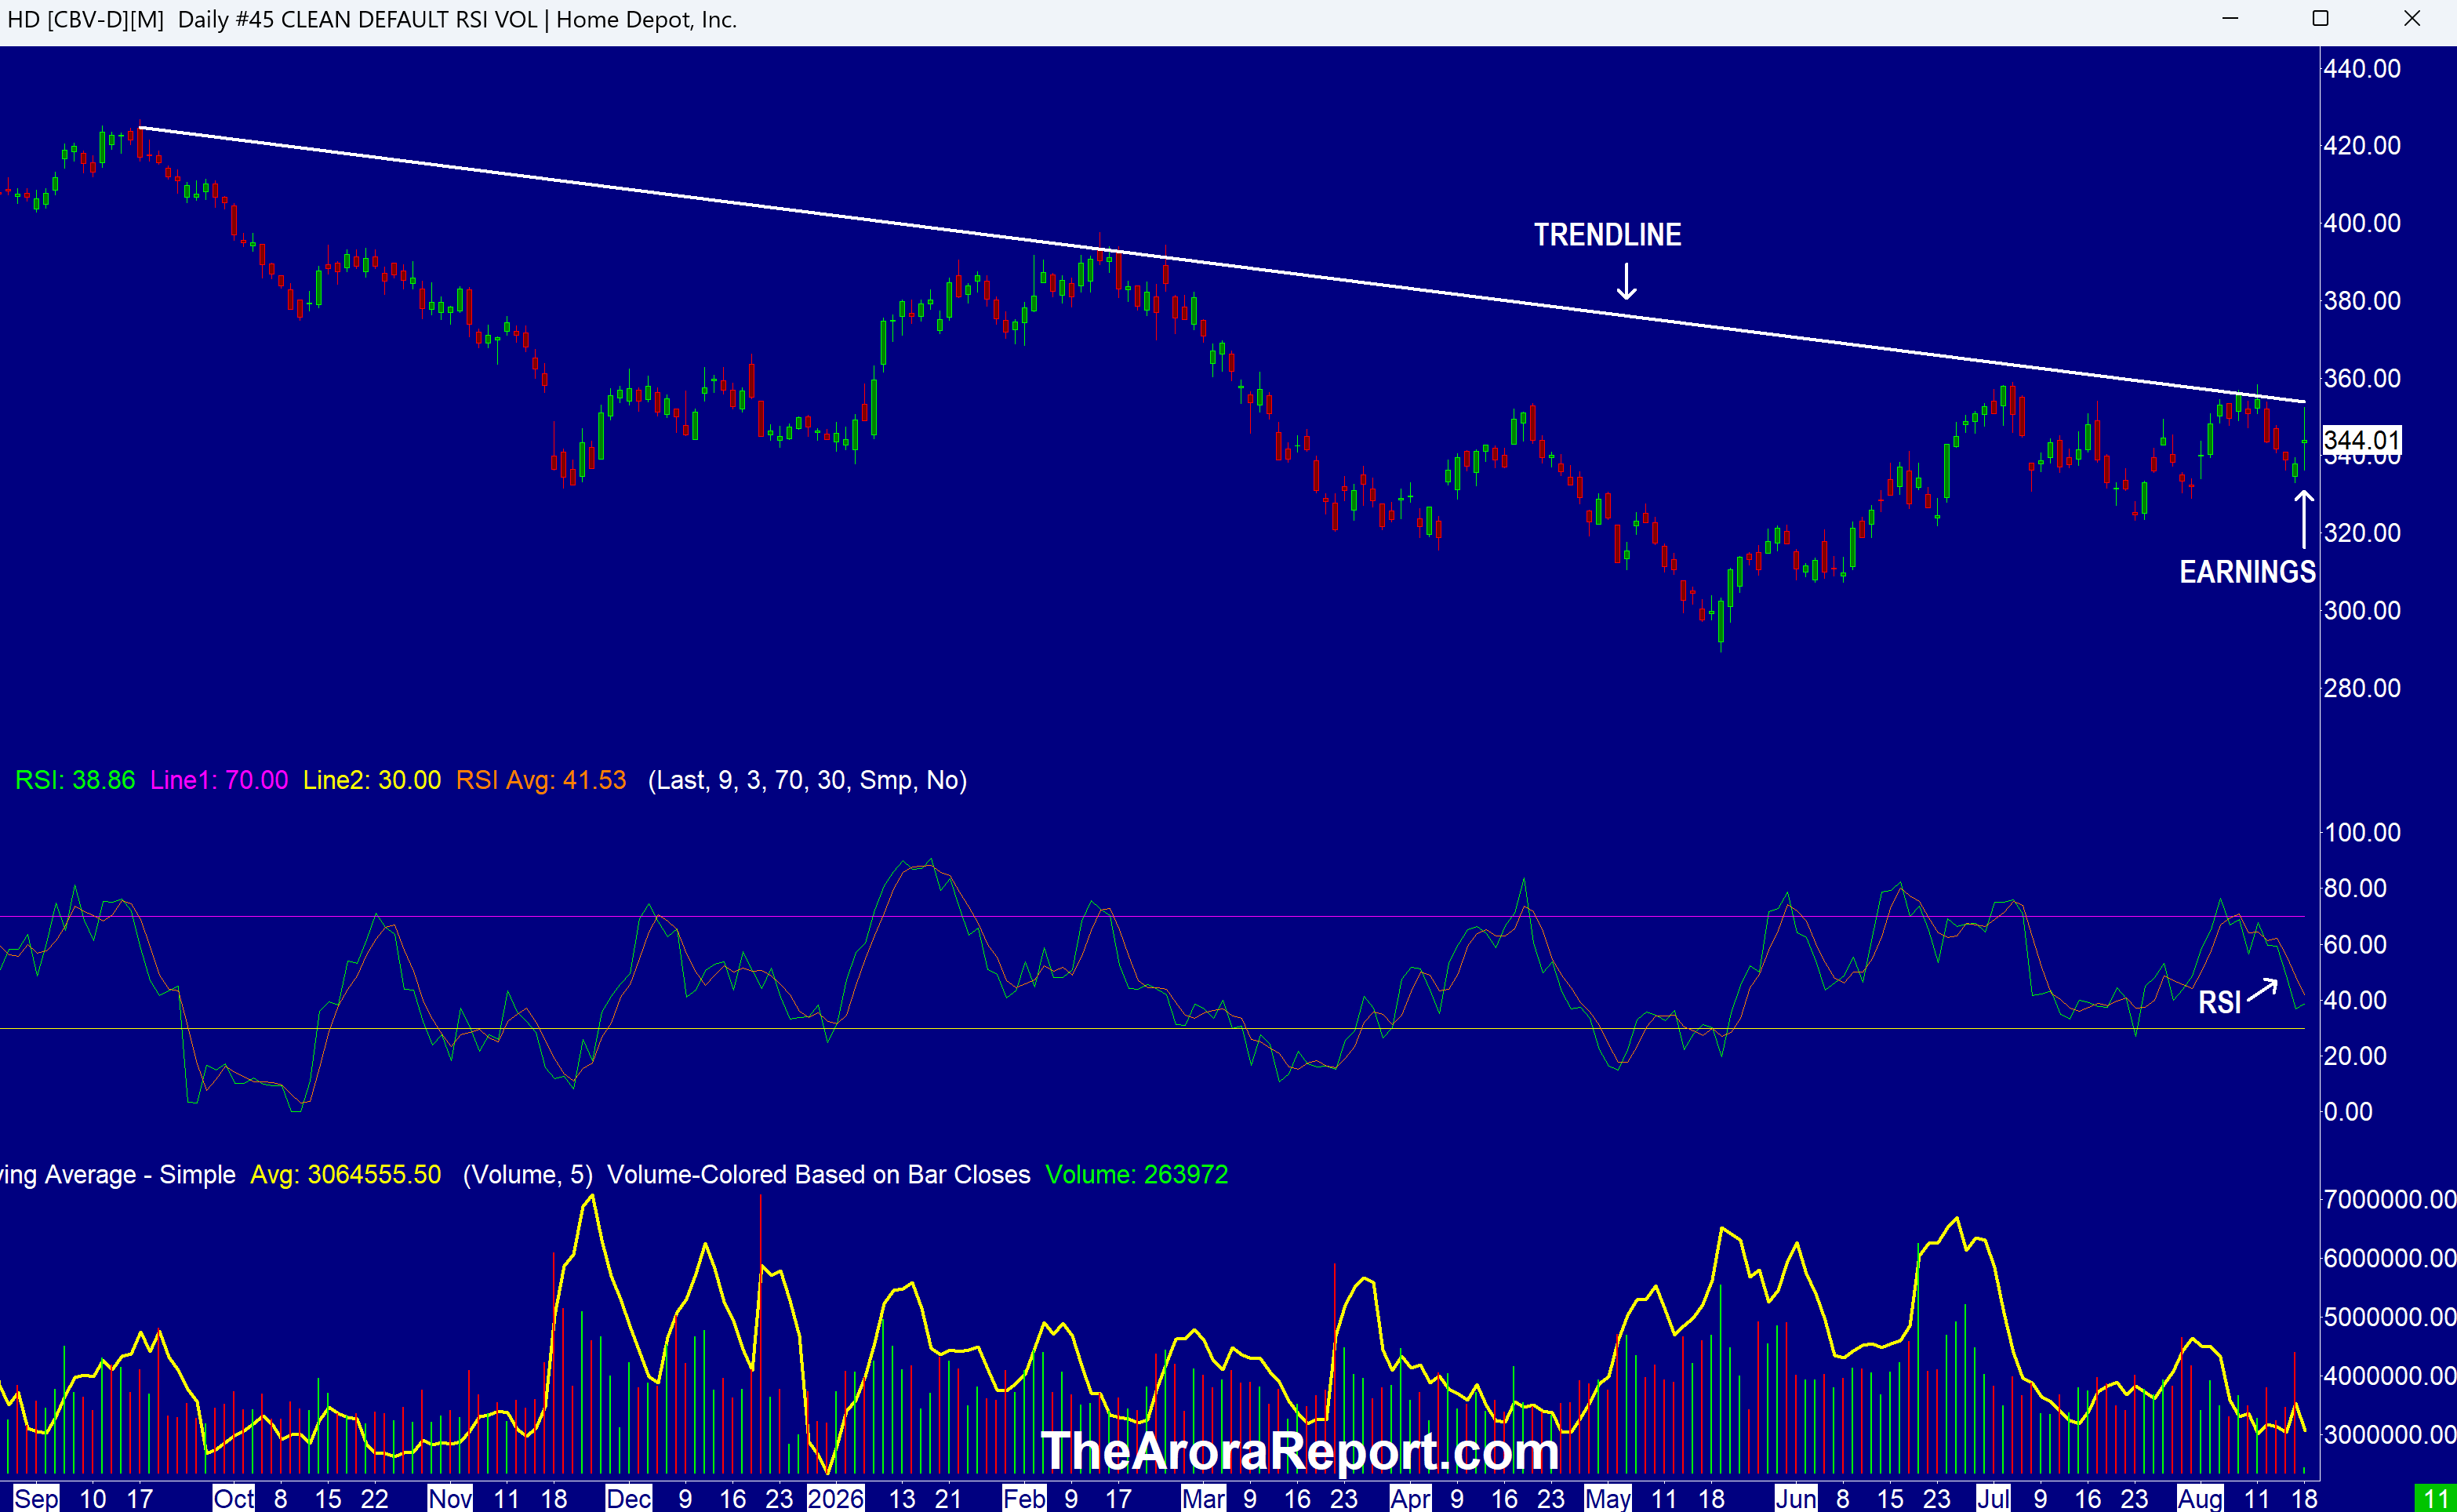
Please click here for an enlarged chart of Home Depot Inc (NYSE:HD).
Note the following:
- This article is about the big picture, not an individual stock. The chart of HD stock is being used to illustrate the point.
- The trendline on the chart shows HD stock has been in a downtrend. The reason has been persistently high interest rates.
- The chart shows HD stock is gapping up on earnings.
- Prudent investors should keep an eye if HD stock can break above the trendline shown on the chart. A break above the trendline will likely be a positive tell for the entire stock market. On the other hand, if the rally that is starting today fails, it will be a negative.
- Home Depot earnings are important because it is the largest home improvement retailer in the U.S. Its earnings give another important data point on the consumer picture. Consumers are important because the U.S. economy is 70% consumer based.
- Home Depot earnings are better than consensus and whisper numbers. Here are the details:
- Home Depot reported EPS of $4.92 vs. $4.73 consensus.
- Home Depot reported Q2 revenue of $47.86B vs. $47.24B consensus.
- Home Depot guides FY27 earnings of $14.69 – $15.28 vs. $14.94 consensus.
- Home Depot guides FY27 revenue of $168.8B – $172.1B vs. $170.94B consensus.
- Alarm bells are ringing about the U.S. national debt. Smart money is paying attention, but the stock market momo crowd is oblivious. U.S. national debt is quickly approaching $40T. Troubling to smart money are the following:
- U.S. leaders do not have a plan to contain the debt.
- U.S. leaders are talking about measures that will increase the debt growth.
- Yields are rising. As of this writing, the 10 year Treasury yield is 4.736%, and the 30 year Treasury yield is 5.315%. The 30 year yield is the highest since 2007.
- Prudent investors should note that it is not only the U.S. Yields are rising across the globe. There are two reasons:
- Rising debt across the globe
- Concern that oil prices will rise further as the U.S. and Iran are in a stalemate
- In our analysis, the rally in the AI trade that was triggered by the collapse of the $45B Situational Awareness fund that lost 67% in July is showing first signs of exhaustion.
- Memory stocks such as Micron Technology Inc (NASDAQ:MU), SK Hynix Inc – ADR (NASDAQ:SKHY), and SanDisk Corp (NASDAQ:SNDK) have had an explosive rally over the last few days triggered by Sandisk’s investor day. In the early trade, memory stocks are pulling back.
Housing Starts
Rising interest rates are hurting housing. Here is the latest data:
- Housing starts came at 1.239M vs. 1.36M consensus.
- Building permits came at 1.443M vs. 1.39M consensus.
Magnificent Seven Money Flows
Most portfolios are now heavily concentrated in the Mag 7 stocks. For this reason, it is important to pay attention to early money flows in the Mag 7 stocks on a daily basis.
In the early trade, money flows are positive in Apple Inc (NASDAQ:AAPL) and Microsoft Corp (NASDAQ:MSFT).
In the early trade, money flows are negative in Amazon.com, Inc. (NASDAQ:AMZN), Alphabet Inc Class C (NASDAQ:GOOG), Meta Platforms Inc (NASDAQ:META), NVIDIA Corp (NASDAQ:NVDA), and Tesla Inc (NASDAQ:TSLA).
In the early trade, money flows are negative in SPDR S&P 500 ETF Trust (NYSE:SPY) and Invesco QQQ Trust Series 1 (NASDAQ:QQQ).
Momo Crowd And Smart Money In Stocks
Investors can gain an edge by knowing money flows in SPY and QQQ. Investors can get a bigger edge by knowing when smart money is buying stocks, gold, and oil. The most popular ETF for gold is SPDR Gold Trust (GLD). The most popular ETF for silver is iShares Silver Trust (SLV). The most popular ETF for oil is United States Oil ETF (USO).
Bitcoin
Bitcoin (CRYPTO:BTC) is seeing buying.
What To Do Now
Consider continuing to hold good, very long term, existing positions and add tactical positions based on signals.
The Arora Report is known for its accurate calls. The Arora Report correctly called the big artificial intelligence rally before anyone else, the new bull market of 2023, the bear market of 2022, new stock market highs right after the virus low in 2020, the virus drop in 2020, the DJIA rally to 30,000 when it was trading at 16,000, the start of a mega bull market in 2009, and the financial crash of 2008. Please click here to sign up for a free forever Generate Wealth Newsletter.
Benzinga Disclaimer: This article is from an unpaid external contributor. It does not represent Benzinga’s reporting and has not been edited for content or accuracy.
Login to comment