Weakening Consumer
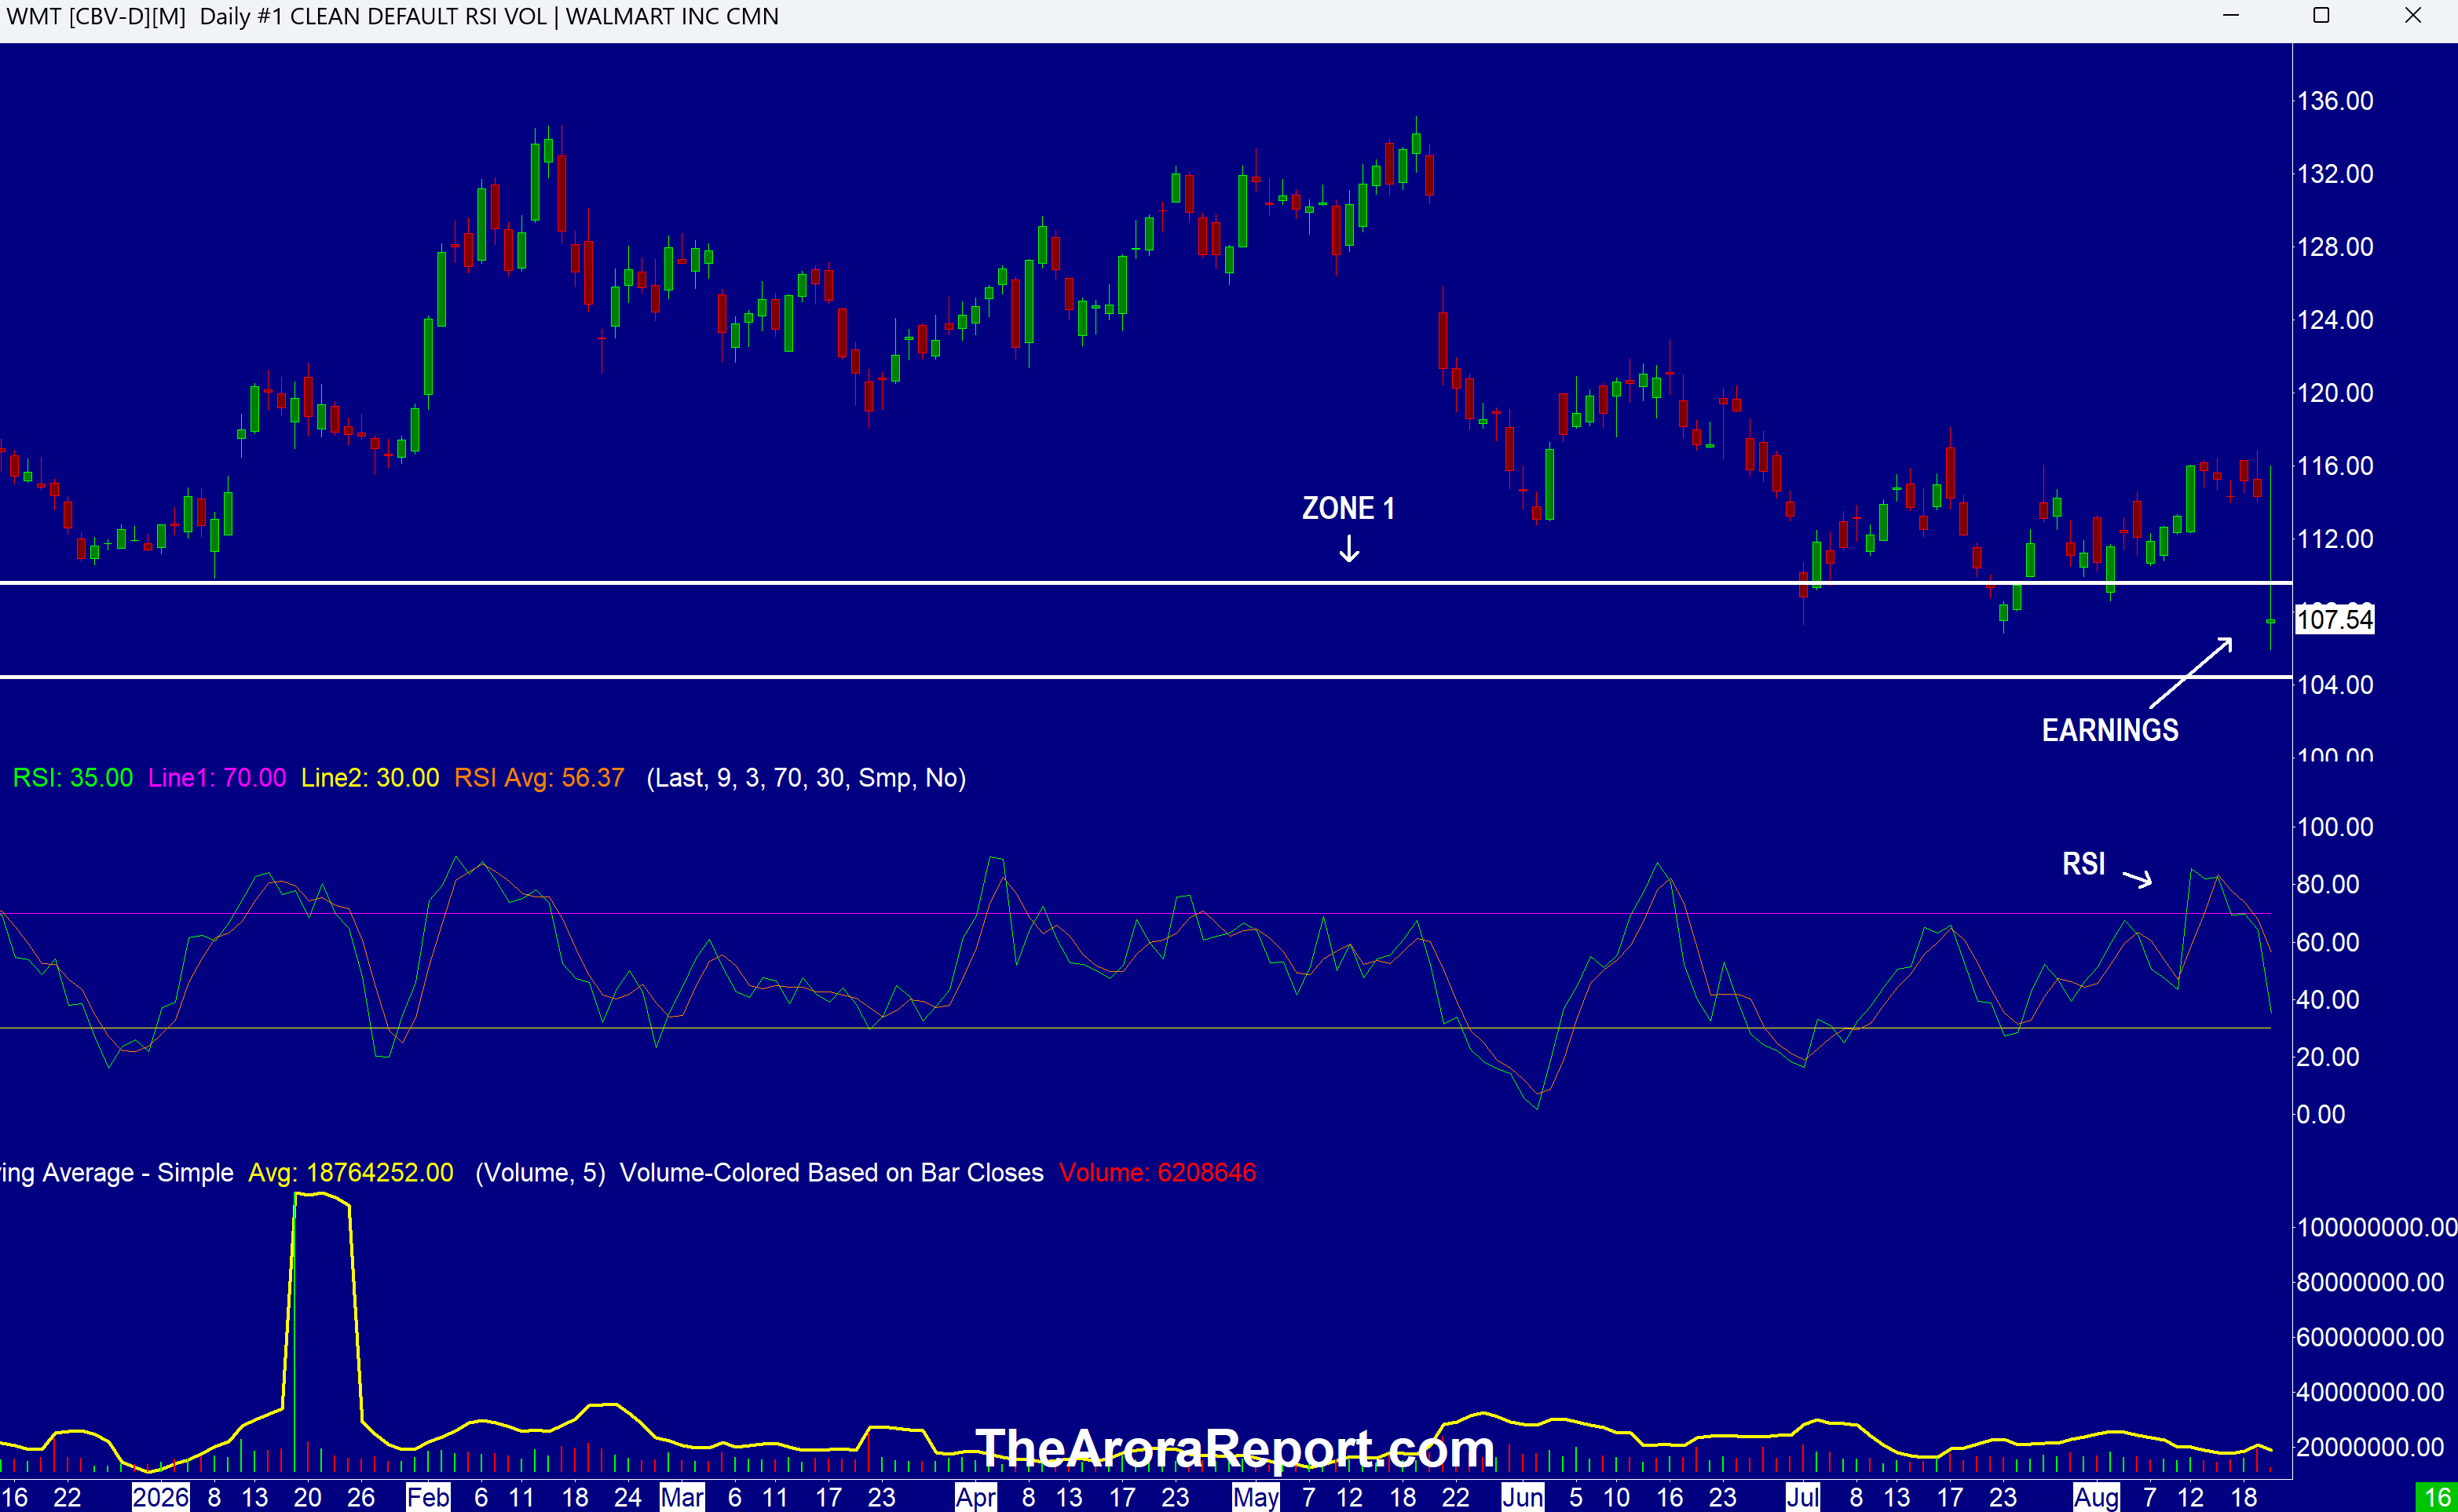
Please click here for an enlarged chart of Walmart Inc (NASDAQ:WMT).
Note the following:
- This article is about the big picture, not an individual stock. The chart of WMT stock is being used to illustrate the point. Walmart is the largest U.S. retailer, and thus its earnings provide an important data point about the consumer. The consumer is important because the U.S. economy is about 70% consumer based.
- The chart shows WMT stock has fallen into zone 1 (support) after earnings.
- RSI on the chart shows WMT stock is not yet oversold.
- Walmart missed consensus and whisper numbers on projections. Here are the details:
- Walmart reported Q2 EPS of $0.81 vs. $0.74 consensus.
- Walmart reported Q2 revenue of $187.9B vs. $186.62B consensus.
- Walmart guides Q3 EPS of $0.62 – $0.64 vs. $0.68 consensus.
- As a full disclosure, WMT is in our portfolio, long from an average of $19.25.
- In our analysis, Walmart earnings reflect a weakening consumer. So far, the consumer has mostly continued to spend. The stock market advance has assumed the consumer will continue to spend. Walmart earnings are providing a contrary data point. This is putting pressure on the entire stock market in the early trade.
- Samsung Electronics Co Ltd (OTCPK:SSNLF) jumped about 9% in South Korea on speculation that Samsung will start a shareholder return program of about $72B. SK Hynix Inc – ADR (NASDAQ:SKHY) jumped about 12% in South Korea on speculation of more shareholder return programs. The South Korean Kospi Index jumped about 6%.
- Prudent investors should note a divergence this morning. Lately, the U.S. stock market, especially the semiconductor sector, has been following the South Korean market. However this morning, semiconductor stocks in the U.S. are coming under pressure due to rising yields. Even memory stocks Micron Technology Inc (NASDAQ:MU) and SanDisk Corp (NASDAQ:SNDK) are not following South Korea’s lead.
- Yields are rising this morning as the euphoria from yesterday’s Treasury buyback announcement fades. Please see yesterday’s Morning Capsule for details.
- Also putting pressure on the stock market is rising oil. Oil is rising due to the U.A.E. deciding to suspend economic ties with Iran under U.S. pressure. The U.A.E., China, and Russia have been the three most important economic partners of Iran.
- Initial jobless claims came 206K vs. 206K consensus. This indicates employment is holding up.
Magnificent Seven Money Flows
Most portfolios are now heavily concentrated in the Mag 7 stocks. For this reason, it is important to pay attention to early money flows in the Mag 7 stocks on a daily basis.
In the early trade, money flows are positive in Meta Platforms Inc (NASDAQ:META).
In the early trade, money flows are neutral in Apple Inc (NASDAQ:AAPL), NVIDIA Corp (NASDAQ:NVDA), and Microsoft Corp (NASDAQ:MSFT).
In the early trade, money flows are negative in Amazon.com, Inc. (NASDAQ:AMZN), Alphabet Inc Class C (NASDAQ:GOOG), and Tesla Inc (NASDAQ:TSLA).
In the early trade, money flows are negative in SPDR S&P 500 ETF Trust (NYSE:SPY) and Invesco QQQ Trust Series 1 (NASDAQ:QQQ).
Momo Crowd And Smart Money In Stocks
Investors can gain an edge by knowing money flows in SPY and QQQ. Investors can get a bigger edge by knowing when smart money is buying stocks, gold, and oil. The most popular ETF for gold is SPDR Gold Trust (GLD). The most popular ETF for silver is iShares Silver Trust (SLV). The most popular ETF for oil is United States Oil ETF (NYSE:USO).
Bitcoin
A vicious short squeeze started in Bitcoin (CRYPTO:BTC) on yesterday’s Treasury announcement that was discussed in yesterday’s Morning Capsule. The bitcoin short squeeze took another leg up on a positive statement from President Trump.
What To Do Now
Consider continuing to hold good, very long term, existing positions and add tactical positions based on signals.
The Arora Report is known for its accurate calls. The Arora Report correctly called the big artificial intelligence rally before anyone else, the new bull market of 2023, the bear market of 2022, new stock market highs right after the virus low in 2020, the virus drop in 2020, the DJIA rally to 30,000 when it was trading at 16,000, the start of a mega bull market in 2009, and the financial crash of 2008. Please click here to sign up for a free forever Generate Wealth Newsletter.
Benzinga Disclaimer: This article is from an unpaid external contributor. It does not represent Benzinga’s reporting and has not been edited for content or accuracy.
Login to comment