Labor Day looks like just another long weekend on the calendar. It isn’t. Every year around this time, a specific corner of the market shifts in a way that’s repeated itself with almost eerie consistency, and most people miss it completely because they’re too busy closing the grill for the season.
I don’t chase headlines or hot stocks. I track years of market behavior around specific dates to find windows where the odds tilt hard in one direction, and then I wait for the setup to confirm itself again. This is one of the clearest ones on my calendar all year, and the window to act on it opens the moment the holiday ends.
Over the last 10 years, this pattern has played out the same way 9 times. Not a coin flip. Not a hunch. A rules-based setup with a track record you can actually check. I’m about to show you exactly what it is, how simple the trade is, and why the days right after Labor Day matter more than the days before it.
Why Holidays Can Move the Market
The market tends to move in rhythm with the social calendar more than most folks realize. Around major holidays, trading volume can change, consumers spend differently, investors adjust positions, and institutional money moves in and out of the market.
And when that behavior repeats around the same time year after year, it can leave behind a pattern.
That’s what I’m looking for.
I’m not trying to predict the next headline or chase whatever stock happens to be hot that day. I’m looking at historical data to find short-term windows where the market has consistently leaned in one direction.
Some of the holiday patterns I track have historically worked 80%, 90%, or even 100% of the time over a 10-year period.
Of course, that doesn’t mean they’re guaranteed to work again. Nothing in the market is.
But when the same move keeps showing up during the same seasonal window, I want to know about it.
And that brings us to Labor Day.
The 90% Labor Day Pattern
Labor Day is basically Wall Street’s “back-to-school” moment.
The slower summer trading period is winding down. Institutional traders are returning to their desks. And the market begins repositioning for September, a month that can bring its own share of volatility.
That makes the period immediately following Labor Day particularly interesting.
And one pattern that stands out involves the Invesco DB U.S. Dollar Index Bullish Fund (NYSE:UUP).
UUP is an ETF designed to rise as the U.S. dollar strengthens against a basket of major global currencies.
And historically, the period following Labor Day has been a good one for the dollar.
Over the last 10 years, UUP moved higher in 9 out of 10 years during this post-Labor Day window.
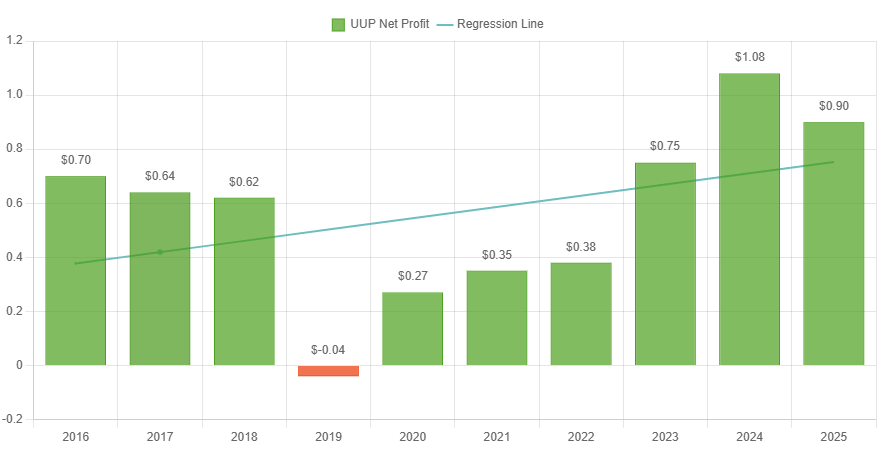
The only red year on the board was 2019. Every other year since 2016 closed in the green, and the trendline has been sloping higher, with 2024 marking the strongest post-Labor Day stretch of the bunch.
That’s a 90% historical win rate.
Now, the gains themselves have been relatively modest.
But I’m not necessarily looking for a huge move here. I’m looking for consistency.
And when I see the same directional move show up nine times over a 10-year period during roughly the same stretch of the calendar, I pay attention.
The Trade Is Surprisingly Simple
The trade itself is pretty straightforward:
Buy UUP after Labor Day and hold the position for 10 trading days.
That’s it.
No trying to predict what the Fed is going to say. No chasing the latest headline. No guessing which stock is going viral next.
It’s simply a short-term, rules-based setup built around a seasonal tendency that has repeated itself in nine of the last 10 years.
Of course, historical performance never guarantees what happens next. There could always be a market-moving event that overpowers a seasonal pattern in any given year.
That’s why I look at these setups as probability windows, not guarantees.
Why Timing Matters With Holiday Trades
And that last point is important, because there’s another lesson in the Labor Day setup that applies to holiday trading in general: the best opportunity doesn’t always come before the holiday.
Holiday patterns generally fall into three buckets.
Pre-holiday patterns begin before the holiday as traders position ahead of an expected seasonal move.
Through-holiday patterns begin before the market closes and continue through the holiday window.
And post-holiday patterns don’t begin until the holiday is over, when traders return to their desks, liquidity comes back into the market, and institutions begin repositioning.
Labor Day falls into that last group.
So while everyone else is firing up the grill and saying goodbye to summer, I’m not looking to jump the gun.
I’m waiting until the holiday is over.
Then I’ll be watching UUP to see if this 90% historical pattern can make it 10 out of 11.
Login to comment