Dangerous Choice For Investors
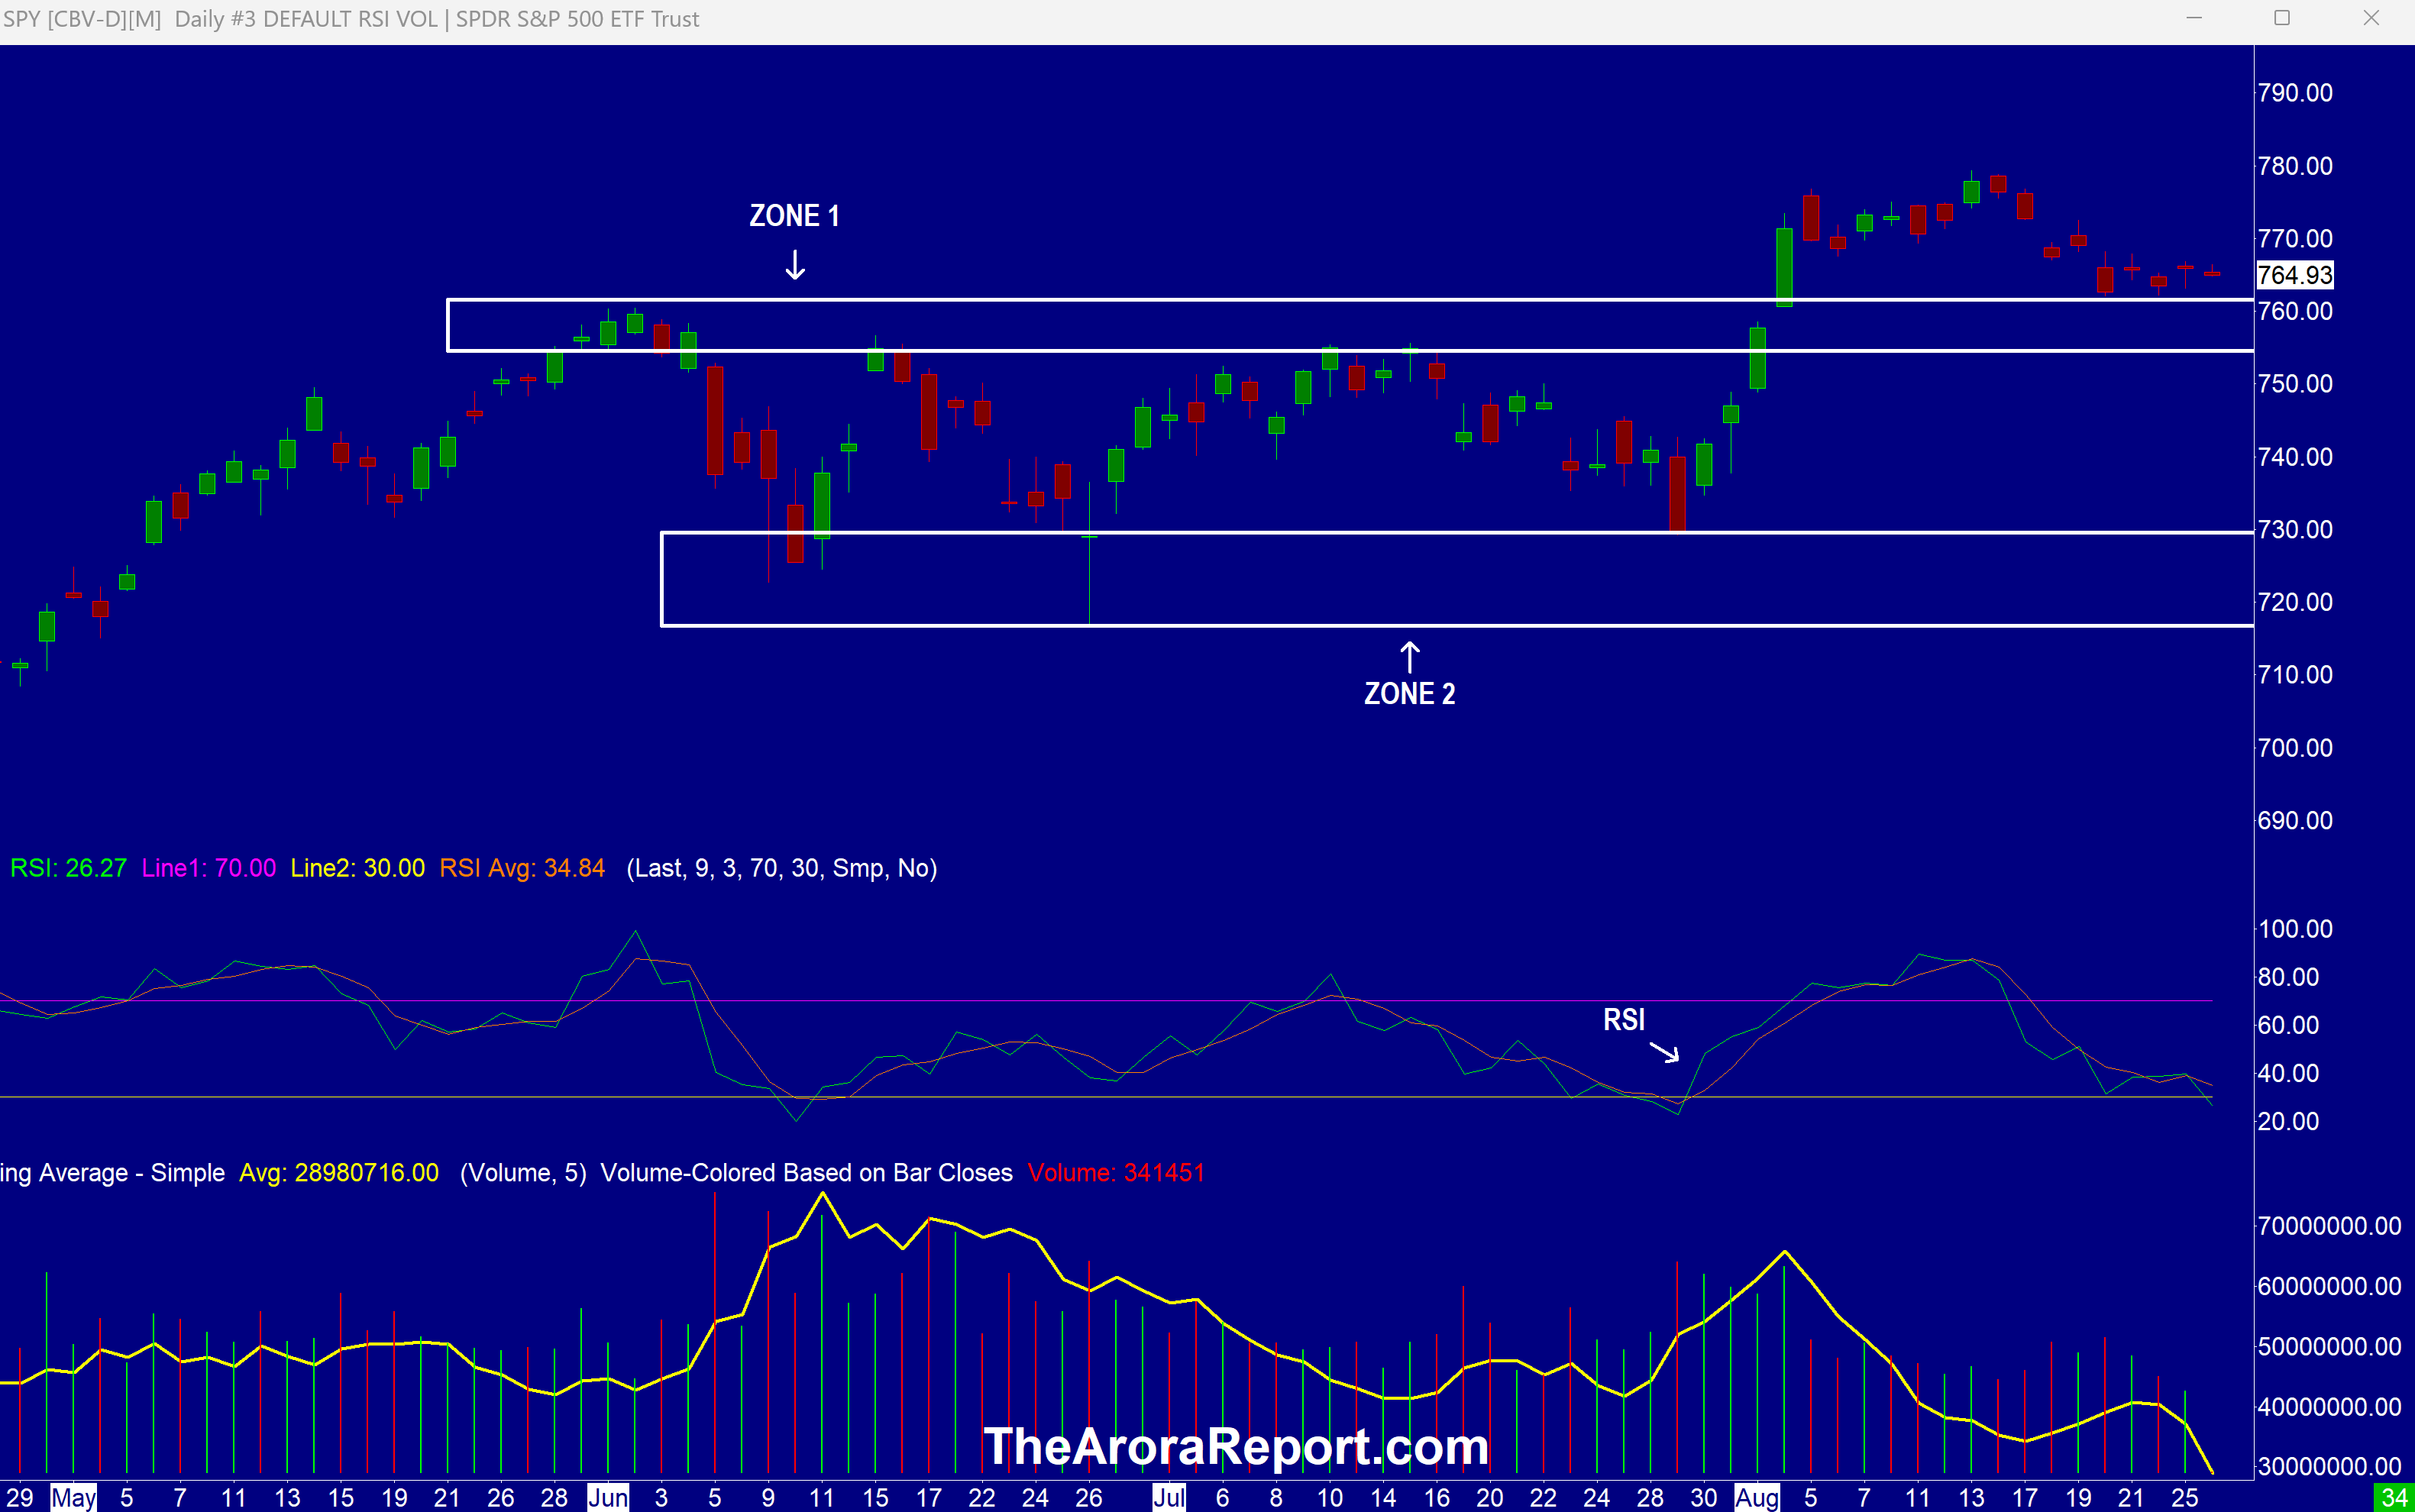
Please click here for an enlarged chart of SPDR S&P 500 ETF Trust (NYSE:SPY) which represents the benchmark stock market index S&P 500 (SPX).
Note the following:
- The chart shows the stock market is pulling back slightly after a slew of economic data.
- To the momo crowd’s dismay, the chart shows that since the breakout above zone 1 (support now but previous resistance), the stock market has not rocketed higher. Instead, the stock market has pulled back.
- Prudent investors should carefully watch if the stock market bounces off to make new highs after bouncing from the top band of zone 1 or the stock market breaks below the top band of zone 1.
- RSI on the chart shows the stock market is oversold. Oversold markets are susceptible to a bounce.
- A slew of economic data released this morning shows the AI boom is colliding with inflation. In our analysis, the Fed faces a dangerous choice for investors. Based on the hard data, the right thing for the Fed to do would be to raise interest rates. However, if the Fed were to raise interest rates aggressively, the momo-driven stock market could crash.
- In our analysis, the probability of the Fed doing the right thing is low. The Fed is under tremendous pressure from President Trump to lower interest rates. Also, the U.S. Treasury’s latest buyback plan puts the Treasury on a collision course with the Fed if the Fed were to do the right thing.
- In our analysis, the actionable item for prudent investors is to be positioned to profit from the AI upside and simultaneously protect their portfolios.
- The U.S. economy is 70% consumer based. For this reason, prudent investors pay attention to personal income and personal spending. Just released personal income and spending data shows why inflation is rising. Here are the details of the new personal income and spending data:
- Personal income came at 0.4% vs. 0.2% consensus.
- Personal spending came at 0.2% vs. 0.2% consensus.
- PCE is the Fed’s favorite inflation gauge. PCE came hotter than expected. Here are the details:
- PCE came at 0.2% vs. 0.1% consensus.
- Core PCE came at 0.2% vs. 0.2% consensus.
- Durable orders data is stronger than expected. Here are the details:
- Durable orders came in at 1.1% vs 0.5% consensus.
- Durable orders ex-transportation came at 0.4% vs 0.5% consensus.
- GDP data is inline with expectations. Here are the details:
- Q2 GDP Second Estimate came at 1.5% vs. 1.5 consensus.
- Q2 GDP Deflator Second Estimate came at 6.4% vs. 6.3% consensus.
- NVIDIA Corp (NASDAQ:NVDA) earnings will be announced after the regular session close and may have a major impact on the stock market.
Magnificent Seven Money Flows
Most portfolios are now heavily concentrated in the Mag 7 stocks. For this reason, it is important to pay attention to early money flows in the Mag 7 stocks on a daily basis.
In the early trade, money flows are positive in Meta Platforms Inc (NASDAQ:META).
In the early trade, money flows are neutral in Apple Inc (NASDAQ:AAPL) and Amazon.com, Inc. (NASDAQ:AMZN).
In the early trade, money flows are negative in Alphabet Inc Class C (NASDAQ:GOOG), Microsoft Corp (NASDAQ:MSFT), Nvidia (NVDA), and Tesla Inc (NASDAQ:TSLA).
In the early trade, money flows are negative in S&P 500 ETF (SPY) and Invesco QQQ Trust Series 1 (NASDAQ:QQQ).
Momo Crowd And Smart Money In Stocks
Investors can gain an edge by knowing money flows in SPY and QQQ. Investors can get a bigger edge by knowing when smart money is buying stocks, gold, and oil. The most popular ETF for gold is SPDR Gold Trust (NYSE:GLD). The most popular ETF for silver is iShares Silver Trust (NYSE:SLV). The most popular ETF for oil is United States Oil ETF (NYSE:USO).
Gold
As we previously shared with you, the gold rally had started due to purchases by Chinese investors to protect themselves from the government’s crackdown on moving money abroad. Over the last few days, Chinese buying has slowed. As a result, we shared with you yesterday that smart money was selling gold. In a divergence, the momo crowd was aggressively buying call options on gold. Gold is seeing a pullback after release of the economic data. In the early trade, smart money continues to sell gold, and the momo crowd continues to aggressively buy gold.
Oil
Oil has seen selling on Iran and Oman reaching an agreement to manage traffic through the Strait of Hormuz.
API crude inventories came at a build of 4.2M barrels vs. a consensus of a build of 1.8M barrels.
Bitcoin
Bitcoin (CRYPTO:BTC) is seeing selling after the release of new economic data. A short squeeze in bitcoin is also showing signs of ending.
What To Do Now
Consider continuing to hold good, very long term, existing positions and add tactical positions based on signals.
The Arora Report is known for its accurate calls. The Arora Report correctly called the big artificial intelligence rally before anyone else, the new bull market of 2023, the bear market of 2022, new stock market highs right after the virus low in 2020, the virus drop in 2020, the DJIA rally to 30,000 when it was trading at 16,000, the start of a mega bull market in 2009, and the financial crash of 2008. Please click here to sign up for a free forever Generate Wealth Newsletter.
Benzinga Disclaimer: This article is from an unpaid external contributor. It does not represent Benzinga’s reporting and has not been edited for content or accuracy.
Login to comment