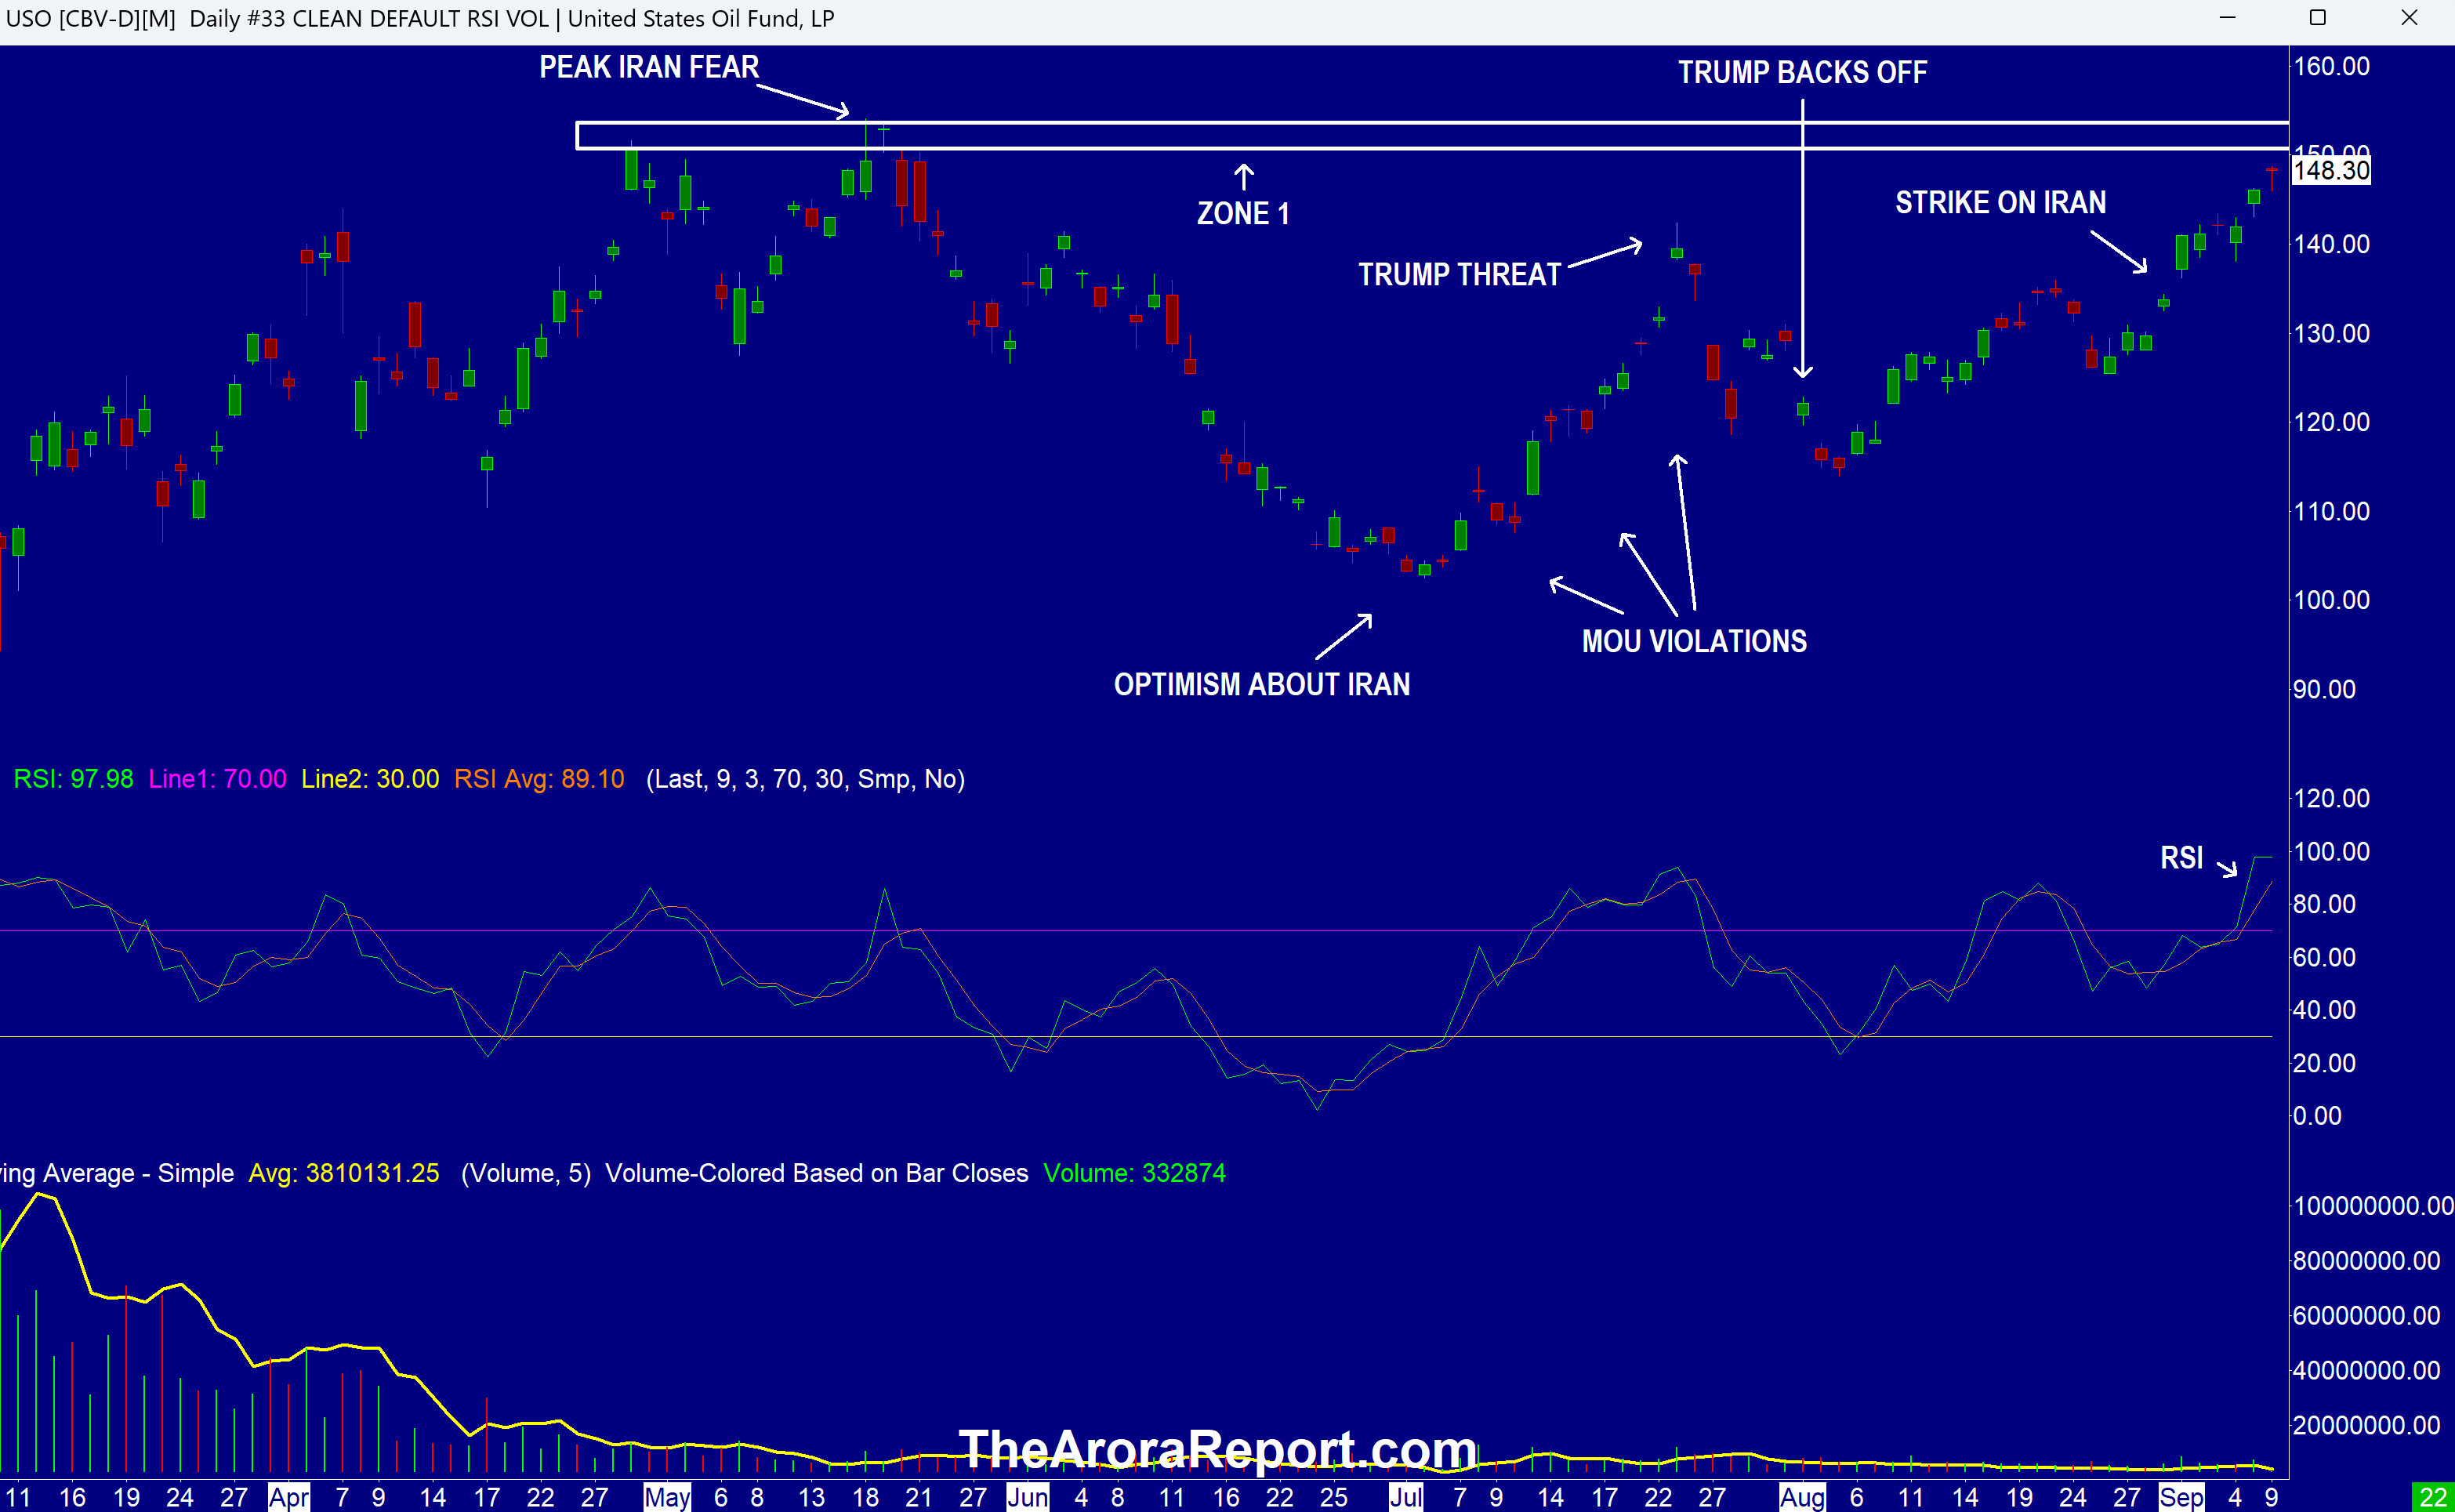
Oil Surge
Please click here for an enlarged chart of United States Oil ETF (NYSE:USO).
Note the following:
- The chart shows USO is approaching zone 1 (resistance).
- The chart shows oil was previously in zone 1 when there was peak Iran fear.
- RSI on the chart shows oil is very overbought.
- Prudent investors should make a note that Iran fear has faded away but oil is now close to where it was during peak Iran fear. The predictive power of this simple observation is that the likelihood of oil breaking above zone 1 is fairly high.
- Especially impacting the markets this morning is that Brent crude is crossing $100. $100 for Brent is an important psychological mark. Brent is the international standard for oil.
- The immediate trigger for the move in oil is the U.S. destroying four tankers belonging to Iran as a response to Iran’s attempt to attack U.S. warships.
- Rising oil is raising inflation concerns. Yields are rising. Prudent investors should note that later today the U.S. Treasury will announce the size of the long term bond buyback tomorrow.
- The yen is rising. In our analysis of the data, some funds are beginning to unwind the carry trade due to rising yen. In the carry trade, funds have borrowed hundreds of billions of dollars in Japan to invest in the U.S., lately in the AI trade.
- Prudent investors should keep a careful eye on the carry trade unwind as it can bring significant selling in stocks if it continues. An easy way to do so is to watch the yen. As a reference, USD-JPY is trading at $153.46 as of this writing. As late as July 27, traders were aggressively selling yen, causing USD-JPY to reach $163.95. Since then, the yen has been rising as Treasury Secretary Bessent has shown significant support for the yen.
- In our analysis, the U.S. has a good reason to support the yen. If the U.S. was not willing to support the yen, the Bank of Japan (BOJ) would have sold the U.S. Treasuries it holds to raise dollars to intervene in the market. At this time of rising Treasury yields, the last thing the U.S. needs is the BOJ selling U.S. Treasuries.
- Apple Inc (NASDAQ:AAPL) is very important because investors have been hiding in AAPL stock. Under new CEO Jon Ternus, Apple is expected to launch its $2000 foldable iPhone today. Apple is years behind Samsung Electronics Co Ltd (OTCPK:SSNLF) on foldable phones. How well the foldable iPhone sells will be important for Apple and, in turn, the stock market.
- Producer Price Index (PPI) will be released tomorrow at 8:30am ET.
Magnificent Seven Money Flows
Most portfolios are now heavily concentrated in the Mag 7 stocks. For this reason, it is important to pay attention to early money flows in the Mag 7 stocks on a daily basis.
In the early trade, money flows are positive in Meta Platforms Inc (NASDAQ:META).
In the early trade, money flows are neutral in Microsoft Corp (NASDAQ:MSFT).
In the early trade, money flows are negative in Amazon.com, Inc. (NASDAQ:AMZN), Alphabet Inc Class C (NASDAQ:GOOG), NVIDIA Corp (NASDAQ:NVDA), Tesla Inc (NASDAQ:TSLA), and Apple (AAPL).
In the early trade, money flows are negative in SPDR S&P 500 ETF Trust (NYSE:SPY) and Invesco QQQ Trust Series 1 (NASDAQ:QQQ).
Momo Crowd And Smart Money In Stocks
Investors can gain an edge by knowing money flows in SPY and QQQ. Investors can get a bigger edge by knowing when smart money is buying stocks, gold, and oil. The most popular ETF for gold is SPDR Gold Trust (GLD). The most popular ETF for silver is iShares Silver Trust (SLV). The most popular ETF for oil is United States Oil ETF (USO).
Bitcoin
Bitcoin (CRYPTO:BTC) is range bound.
What To Do Now
Consider continuing to hold good, very long term, existing positions and add tactical positions based on signals.
The Arora Report is known for its accurate calls. The Arora Report correctly called the big artificial intelligence rally before anyone else, the new bull market of 2023, the bear market of 2022, new stock market highs right after the virus low in 2020, the virus drop in 2020, the DJIA rally to 30,000 when it was trading at 16,000, the start of a mega bull market in 2009, and the financial crash of 2008. Please click here to sign up for a free forever Generate Wealth Newsletter.
Benzinga Disclaimer: This article is from an unpaid external contributor. It does not represent Benzinga’s reporting and has not been edited for content or accuracy.
Login to comment