Dovish Hike Hopium
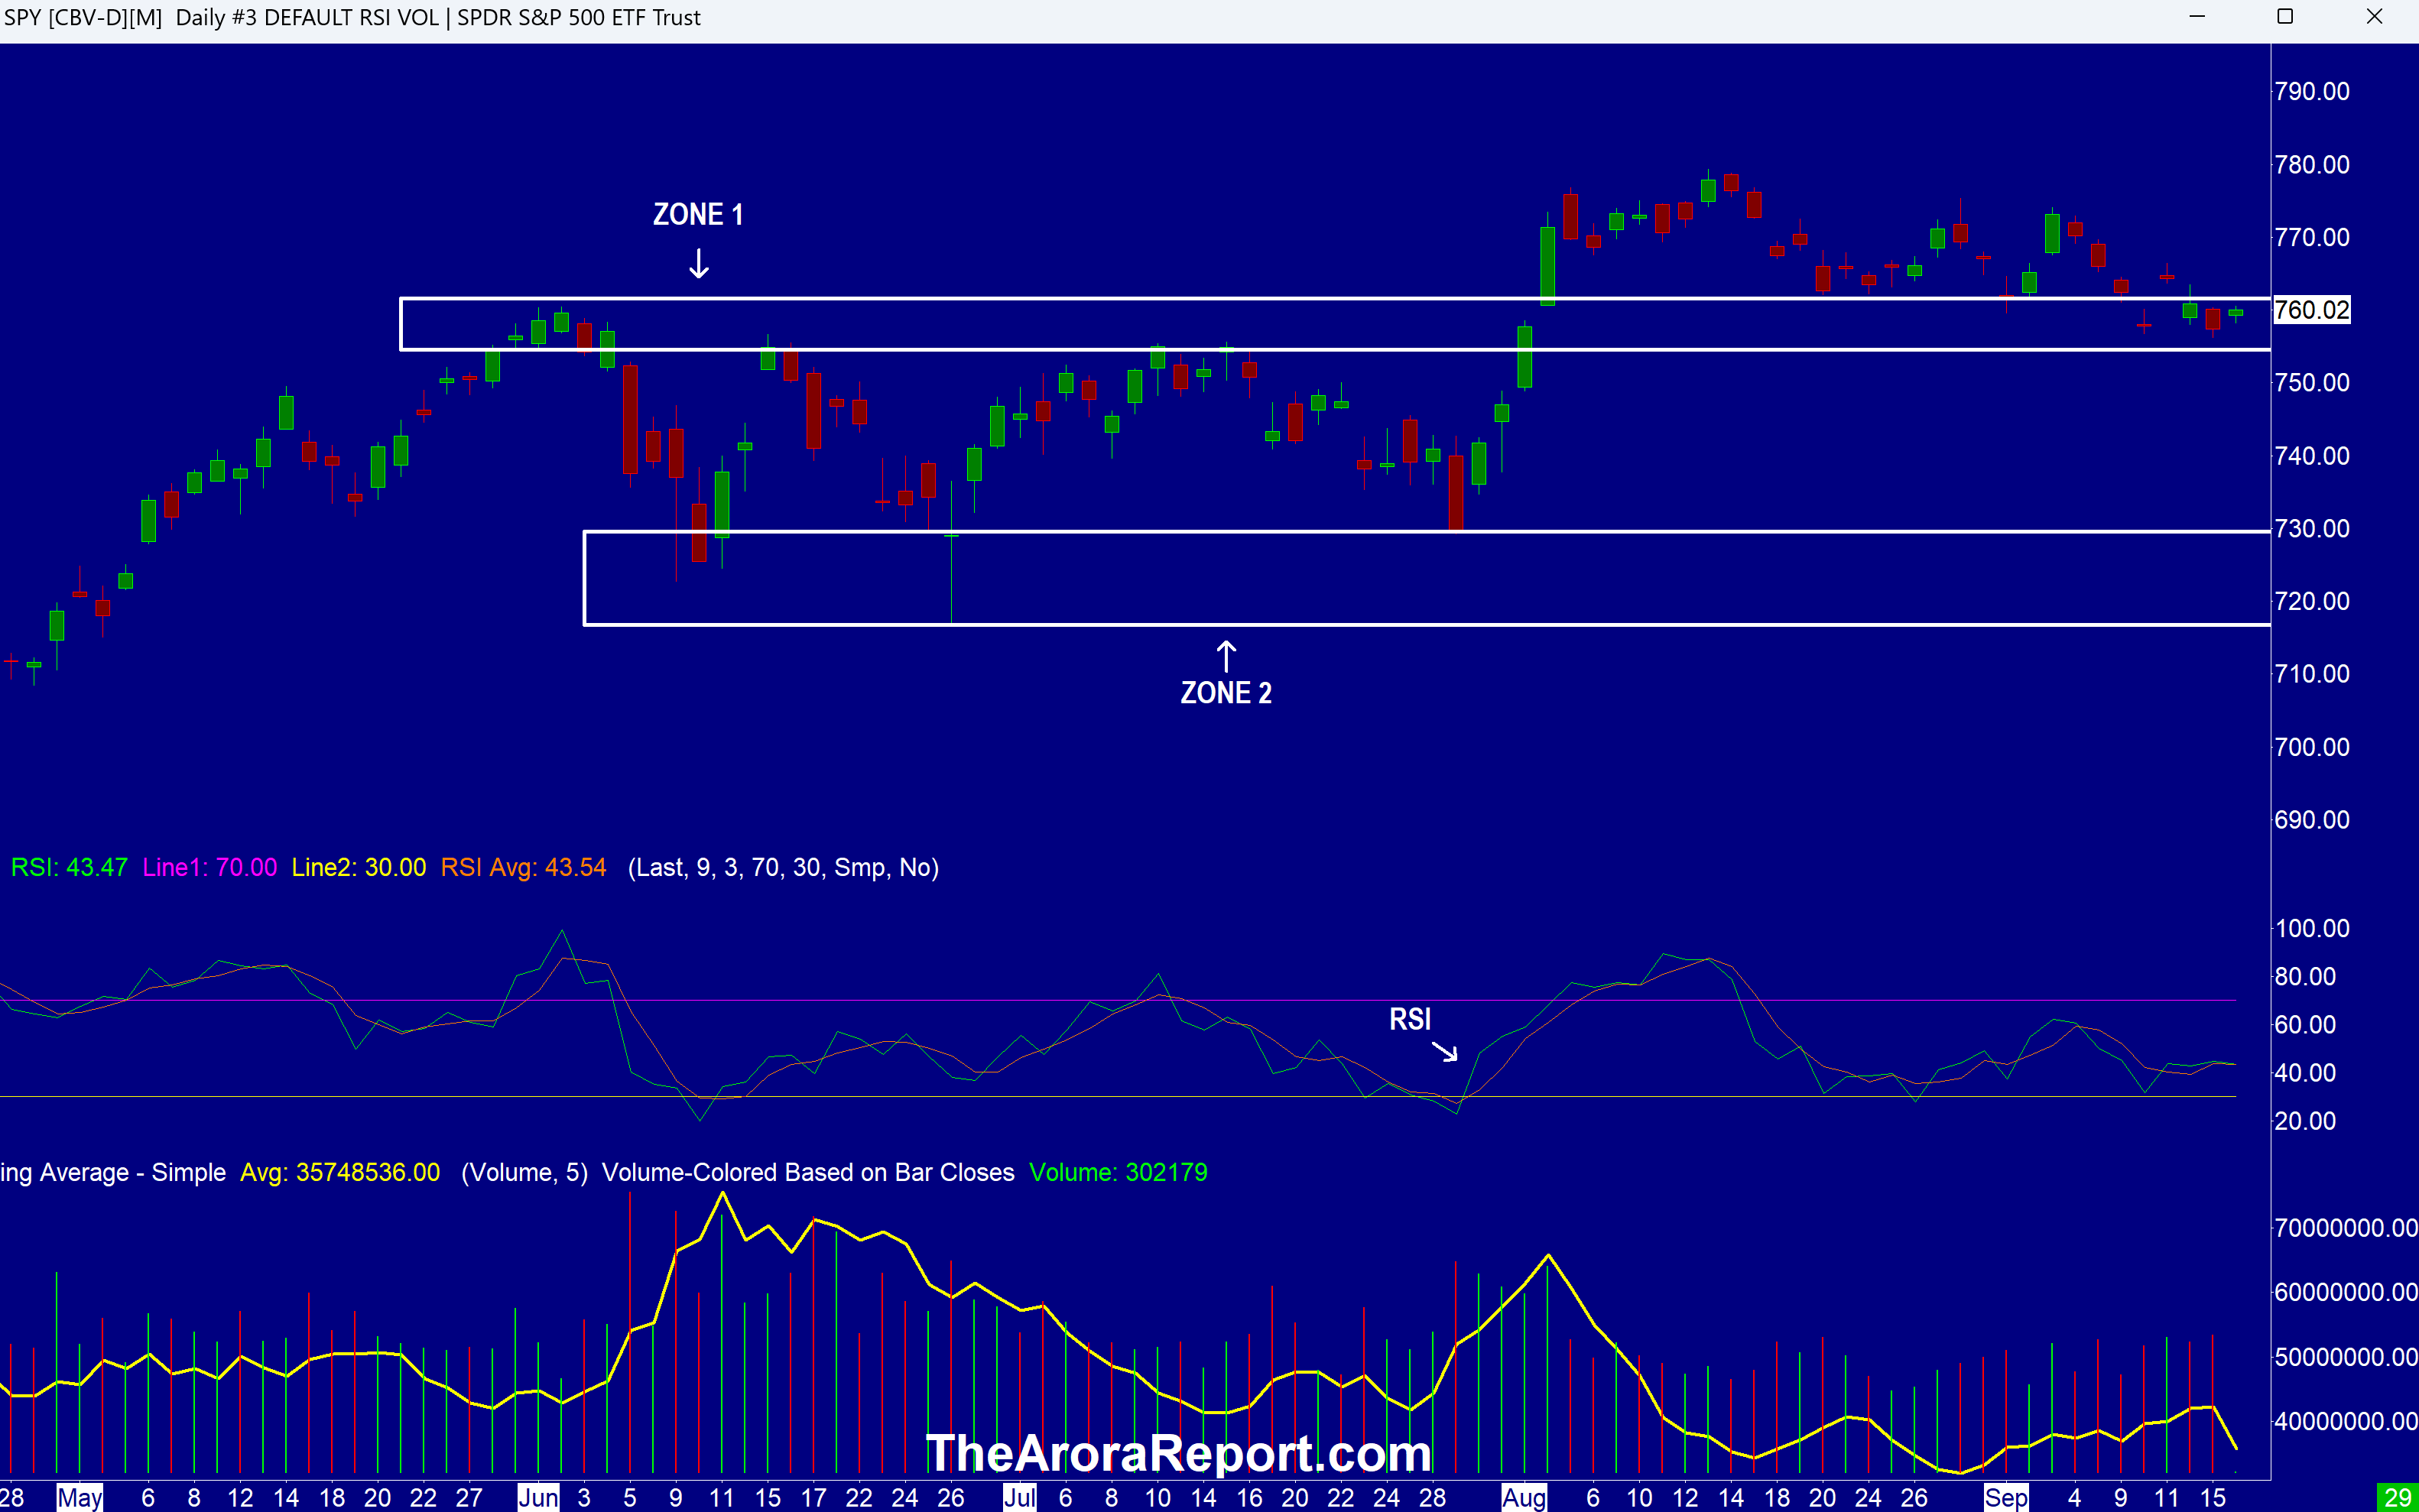
Please click here for an enlarged chart of SPDR S&P 500 ETF Trust (NYSE:SPY) which represents the benchmark stock market index S&P 500 (SPX).
Note the following:
- The chart shows that the stock market is in zone 1 (support).
- The chart shows buying in the early trade in stocks this morning.
- The buying in stocks is mostly from the momo crowd. The momo crowd’s pattern is to buy ahead of key events, such as the Fed’s rate decision because the momo crowd buys on hopium of the potential rewards and does not take risk into account. In contrast, smart money takes into account both potential risks and rewards, and as such, seldom buys ahead of key events.
- Momo gurus are doing a great job with the narrative that today’s hike will be a dovish hike. Momo guru’s job is to run up the stock market under the disguise of analysis.
- In our analysis, a dovish hike means "one and done" or some other way of Fed Chair Warsh communicating that the Fed will not engage in further interest rate hikes.
- The first problem is that Fed Chair Warsh has clearly stated that he does not want to give forward guidance, so how is he going to communicate that the rate hike is dovish without forward guidance?
- The second issue is that Fed Chair Warsh has come out strongly in favor of controlling inflation. If Fed Chair Warsh comes out dovish, it will fly in the face of what he has been consistently saying. Fed Chair Warsh coming out dovish will negatively impact his carefully built image that he is an inflation fighter.
- In our analysis, one of the most important Wall Street mechanics is positioning. The stock market is positioned to go higher, irrespective of what the Fed does.
- Further in our analysis, there is potential for violent moves in the stock market if the market reaction after the Fed announcement is not inline with positioning.
- The Fed’s rate decision will be released at 2pm ET.
- Prudent investors closely watch retail sales data as the U.S. economy is 70% consumer based. Retail sales are strong. Here is the latest retail sales data:
- August headline retail sales came at 1.2% vs. 0.9% consensus.
- August retail sales ex-auto came at 1.4% vs. 0.5% consensus.
Magnificent Seven Money Flows
Most portfolios are now heavily concentrated in the Mag 7 stocks. For this reason, it is important to pay attention to early money flows in the Mag 7 stocks on a daily basis.
In the early trade, money flows are positive in Alphabet Inc Class C (NASDAQ:GOOG), Meta Platforms Inc (NASDAQ:META), NVIDIA Corp (NASDAQ:NVDA), and Tesla Inc (NASDAQ:TSLA).
In the early trade, money flows are neutral in Apple Inc (NASDAQ:AAPL) and Amazon.com, Inc. (NASDAQ:AMZN).
In the early trade, money flows are negative in Microsoft Corp (NASDAQ:MSFT).
In the early trade, money flows are negative in S&P 500 ETF (SPY) and Invesco QQQ Trust Series 1 (NASDAQ:QQQ).
Momo Crowd And Smart Money In Stocks
Investors can gain an edge by knowing money flows in SPY and QQQ. Investors can get a bigger edge by knowing when smart money is buying stocks, gold, and oil. The most popular ETF for gold is SPDR Gold Trust (GLD). The most popular ETF for silver is iShares Silver Trust (SLV). The most popular ETF for oil is United States Oil ETF (NYSE:USO).
Oil
API crude inventories came at a build of 7.14M barrels vs. a consensus of a draw of 1.8M barrels.
Oil is pulling back this morning on hopes of some kind of resolution of the Iran War.
Bitcoin
Bitcoin (CRYPTO: BTC) is seeing selling along with crypto related stocks such as Coinbase (COIN), Strategy (MSTR), and Circle Internet Group (CRCL). The reason is the Crypto Related Clarity Act failed in the Senate.
What To Do Now
Consider continuing to hold good, very long term, existing positions and add tactical positions based on signals.
The Arora Report is known for its accurate calls. The Arora Report correctly called the big artificial intelligence rally before anyone else, the new bull market of 2023, the bear market of 2022, new stock market highs right after the virus low in 2020, the virus drop in 2020, the DJIA rally to 30,000 when it was trading at 16,000, the start of a mega bull market in 2009, and the financial crash of 2008. Please click here to sign up for a free forever Generate Wealth Newsletter.
Benzinga Disclaimer: This article is from an unpaid external contributor. It does not represent Benzinga’s reporting and has not been edited for content or accuracy.
Login to comment