Market Overview
Stocks began their breakout to new all-time highs again, but it remains a highly selective environment. Only the Nasdaq hit a record high, as it finished up 2.06% on the week, and outperformed for the fourth week in a row. The S&P 500 was up 1.21%, while the Dow Jones Industrial Average rallied 0.28%. There are a lot of concerns about market breadth, and in time, it is critical that more stocks join the rally. For now, it’s the stocks that make up the most of the market hitting new all-time highs, and that’s a bullish sign. Meanwhile, interest rates continue to soar to multi-year highs. Crude oil dropped and it would seem that a cooling off of geopolitical tensions would give bonds the desperate support they need.
Stocks I Like
Pattern Group (PTRN) – 70% Return Potential

What’s Happening
- Pattern Group Inc. (PTRN) is a leading e-commerce accelerator that combines proprietary technology, AI-driven data analytics, and operational expertise to help consumer brands grow sales across global marketplaces such as Amazon, offering investors exposure to the rapidly growing e-commerce enablement and digital retail sector with a focus on marketplace optimization, inventory management, and profitable brand scaling.
- The last quarter reported revenue of $876.77 million and earnings of $27.5 million.
- Valuation in PTRN is solid. Price-to-Sales is at 1.19, Book Value is 3.63, and EV to EBITDA is at 94.84.
- From a technical standpoint, PTRN is coiled up nicely within a falling wedge formation. A break above the upper trendline should lead to a retest of the former high.
Why It’s Happening
- Pattern Group is scaling as an e-commerce accelerator for consumer brands, buying inventory and selling it across marketplaces with proprietary tech and AI. Second-quarter revenue hit a record $877 million, up 47% year-over-year, as existing partners spent more and new brands came onto the platform.
- Customer expansion is the core engine. Net revenue retention reached a record 129%, up from 118% a year earlier, meaning brands already on Pattern are growing sales through the company rather than the model depending only on new logos.
- Diversification beyond Amazon is accelerating. Revenue not attributable to Amazon nearly doubled to $82 million, up 93%, while international sales have been growing at a triple-digit pace in recent quarters—reducing reliance on a single marketplace even as Amazon remains the largest channel.
- AI and ads are becoming new levers. Pattern launched Pattern Intelligence (Pi), an AI platform for real-time marketplace optimization, and became a technology partner for advertising inside ChatGPT—extending brand reach from traditional marketplaces into conversational shopping.
- The financial profile is catching up with the growth. Adjusted EBITDA is running well ahead of last year, first-half operating cash flow was about $87 million, cash stood at $346 million with no revolver drawn, and the company raised full-year 2026 revenue guidance to $3.42–$3.46 billion (about 37–38% growth) while authorizing a $100 million share repurchase program.
- Analyst Ratings:
- Evercore ISI Group: Outperform
- Needham: Buy
- Keybanc: Overweight
My Action Plan (70% Return Potential)
- I am bullish on PTRN above $17.00-$18.00. My upside target is $29.00-$31.00.
Zai Lab (ZLAB) – 44% Return Potential
What’s Happening
- Zai Lab Limited (ZLAB) is a leading biopharmaceutical company focused on discovering, developing, and commercializing innovative therapies in oncology, immunology, neuroscience, and infectious diseases, bringing globally sourced and internally developed medicines to patients in China and beyond, offering investors exposure to the rapidly growing biotech and specialty pharmaceuticals sector with a focus on addressing unmet medical needs in high-impact therapeutic areas.
- The previous quarter delivered $106.31 million in revenue but still lost $50.83 million in earnings.
- Valuation is high in ZLAB is steep. Price-to-Sales is at 6.51 and Book Value is 5.40.
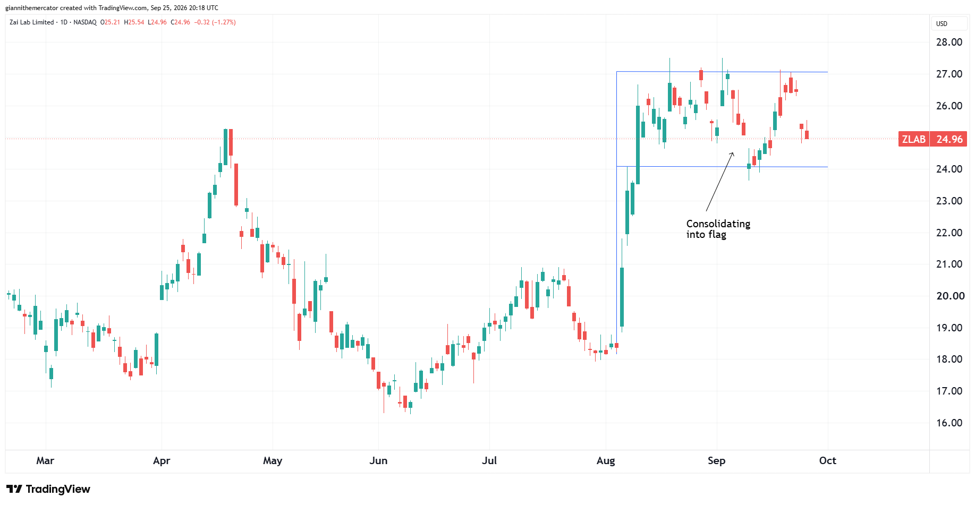
- From a technical perspective, ZLAB is consolidating tightly into a bull flag pattern. These are some of the most powerful patterns in all of technical analysis and portends a strong surge higher.
Why It’s Happening
- Zai Lab is shifting from a Greater China licensing platform into a dual-engine biopharma with its own global pipeline. Second-quarter product revenue was $105.8 million, up 11% sequentially as ZEJULA stabilized and VYVGART volumes grew, while the company ended June with $717.5 million in cash to fund late-stage programs.
- Zoci is the flagship global oncology bet. The DLL3-targeting ADC has shown rapid intracranial responses in small-cell lung cancer with brain metastases, earned U.S. Fast Track and U.S./EU orphan designations, and is moving into multiple registrational studies in second-line-plus SCLC, first-line SCLC, and neuroendocrine carcinomas, with a potential U.S. accelerated-approval path in 2027.
- China launches are adding new commercial legs. KarXT, the first novel schizophrenia mechanism in more than 70 years, launched in mainland China in June, and TIVDAK became the first ADC approved there for recurrent or metastatic cervical cancer—two products that can grow further if they secure National Reimbursement Drug List inclusion.
- The VYVGART franchise keeps expanding beyond myasthenia gravis. Partner argenx’s U.S. label now covers all adult gMG serotypes, and the Phase 3 ALKIVIA trial of efgartigimod in autoimmune myositis met its primary endpoint—opening another immunology indication where Zai Lab holds Greater China rights.
- A homegrown immunology pipeline is coming behind the commercial brands. ZL-1503, a long-acting IL-13/IL-31Rα bispecific for atopic dermatitis, is in Phase 1/1b with first-in-human data expected in the second half of 2026, giving Zai Lab a proprietary shot at a large global dermatology market while it prepares the commercial business for a return to growth in 2027.
- Analyst Ratings:
- Citigroup: Buy
- JP Morgan: Overweight
- Cantor Fitzgerald: Overweight
My Action Plan (44% Return Potential)
- I am bullish on ZLAB above $22.00-$23.00. My upside target is $36.00-$38.00.
Dexcom (DXCM) – 56% Return Potential

What’s Happening
- DexCom, Inc. (DXCM) is a leading medical device company that designs, develops, and commercializes continuous glucose monitoring (CGM) systems for people with diabetes and metabolic health needs, offering real-time glucose insights that reduce reliance on fingerstick testing, providing investors exposure to the rapidly growing diabetes care, wearable health technology, and digital health sector with a focus on improving patient outcomes and expanding access to glucose monitoring.
- The previous quarter had $1.31 billion in revenue and $249.1 million in earnings.
- Valuation in DXCM is a bit high. P/E is at 35.24, Price-to-Sales is at 7.13, and EV to EBITDA is at 21.23.
- From a charting standpoint, DXCM is storing energy for the next explosion higher in momentum. It’s doing so via an ascending triangle pattern.
Why It’s Happening
- Dexcom is still compounding in the core CGM business. Second-quarter revenue rose 13% to $1.31 billion (12% organic), with the U.S. up 11% and international sales up 19%, as G7 adoption and broader access offset a still-maturing over-the-counter channel.
- The G7 15-Day sensor is lifting both loyalty and margins. Dexcom is on track to convert about half of its U.S. user base to the longer-wear system by year-end, all major insulin-pump partners are now compatible, and non-GAAP gross margin improved to about 64% as manufacturing efficiency and mix improved.
- Type 2 diabetes without insulin is the next coverage unlock. Commercial plans already cover more than 7 million of those lives. The CONNECT randomized trial showed a 0.9-point A1c improvement versus standard care, and Dexcom is pushing for Medicare coverage that management expects could take effect around mid-2027—an expansion that is not baked into 2026 guidance.
- Stelo is opening a consumer and pediatric market Dexcom never had. The over-the-counter sensor is now cleared for children as young as two who do not use insulin, the app has been rebuilt with AI-driven insights and food logging, and generative-AI coaching is rolling out to turn glucose data into lifestyle guidance rather than just a number.
- Cash generation is funding growth and buybacks at the same time. First-half free cash flow more than doubled to $600 million, the company held about $1.9 billion in cash, raised full-year 2026 revenue guidance to $5.18–$5.25 billion with higher operating-margin targets, and executed roughly $600 million of share repurchases in the second quarter alone.
- Analyst Ratings:
- Truist Securities: Buy
- TD Cowen: Buy
- Argus Research: Buy
My Action Plan (56% Return Potential)
- I am bullish on DXCM above $75.00-$76.00. My upside target is $135.00-$140.00.
Market-Moving Catalysts for the Week Ahead
The Wall of Worry
Last week, both the S&P 500 and the Nasdaq hit their first all-time highs in months. Normally, this would be cause for celebration, but sentiment is struggling to catch up with price. This is creating a unique environment where staying true to the trend is leaving one in the contrarian camp.
There’s a saying in this business, "A bull market climbs a wall of worry," and it’s true. As a rule, surprises tend to occur in the direction of the underlying trend, and stocks continue to print nothing but higher-highs and higher-lows.
Before we see a meaningful market top, I would prefer to see sentiment move into the camp of euphoria. In reality, it wouldn’t take much for that to occur, even a 10-15% rally higher from current prices would be sufficient to lull the crowd into a trance.
Inflation Data Dependency
This week, we’re back to key inflation data, which remains at the center stage with respect to the Fed rate hike outlook. I like to jokingly call Kevin Warsh a "perma-hawk," but the reality is that the inflation issue began well before his tenure.
The problem with rate hikes in this environment is that high energy prices are stemming from a supply shock more so than robust demand. You can raise rates all you want – it’s not going to solve a supply crisis.
That’s a big reason why geopolitics carries so much weight at the moment. We know that oil prices are the primary driver of inflation expectations – everything is downstream from oil economically. The Fed is unlikely to budge in its current trajectory so long as oil prices stay elevated, and remember, economic data is laggard by nature. It reports what the data was the previous month, whereas markets tend to be forward-looking.
Magnificent ELEVEN Leadership
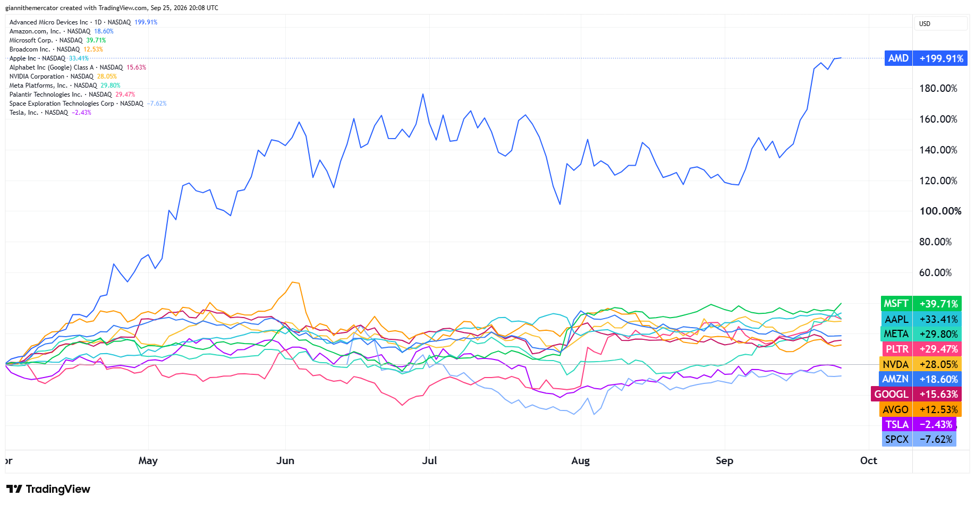
AMD remains the stock to own across the mega-cap tech names. Meta’s resurgence is exactly what I was looking for over the past several weeks, and now it’s in third place since the start of the second quarter. Now, the next candidates to surge are Tesla and SpaceX.
Sector & Industry Strength

Tech did exactly what it needed to do last week. It pulled away from the pack even more, and most importantly, left energy and other defensive sectors in the dust. Communications also jumped a couple spots, which is bullish. I am still happy to see utilities at the bottom of the pack.
| 1 week | 3 Weeks | 13 Weeks | 26 Weeks |
| Technology | Technology | Energy | Technology |
Editor’s Note: A very powerful bullish signal came through for growth last week.
About that Breadth (Sector ETF: MAGS/RSP)
A monumental shift has been unfolding within the equity market over the past few weeks, and it’s one that I’ve been covering extensively in this report. Over the summer, we kept hearing about the "Lag Seven," but now, those very stocks are carrying the market higher.
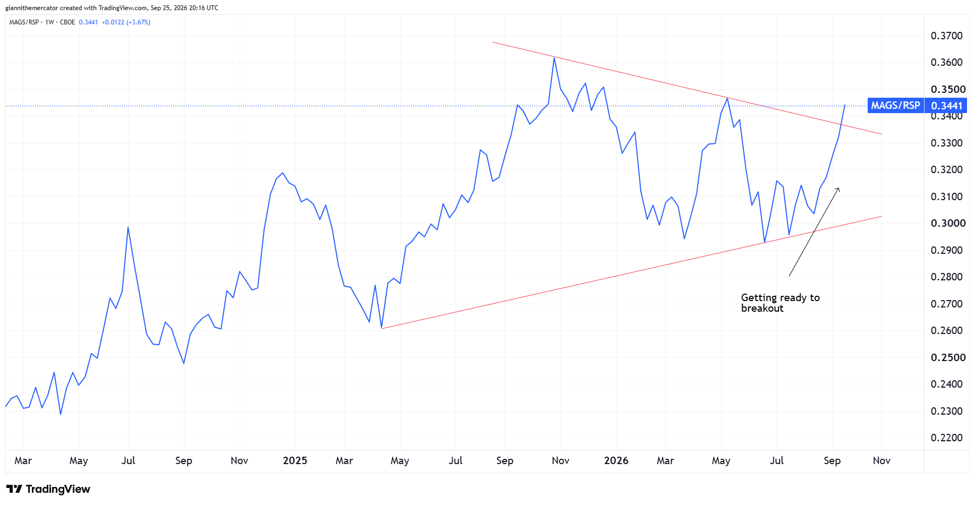
The chart below shows the ratio between the Magnificent Seven (MAGS) and an equal-weight S&P 500 fund (RSP). The biggest takeaway from this chart is that it’s going to be a select handful of names that carry the indices higher.
There’s a clean uptrend in this ratio. It’s making higher-highs and higher-lows, and it’s breaking out from a symmetrical triangle now. This signals that market concentration is only going to increase from here.
Crypto Accelerating (Sector ETF: BTC/GLD)
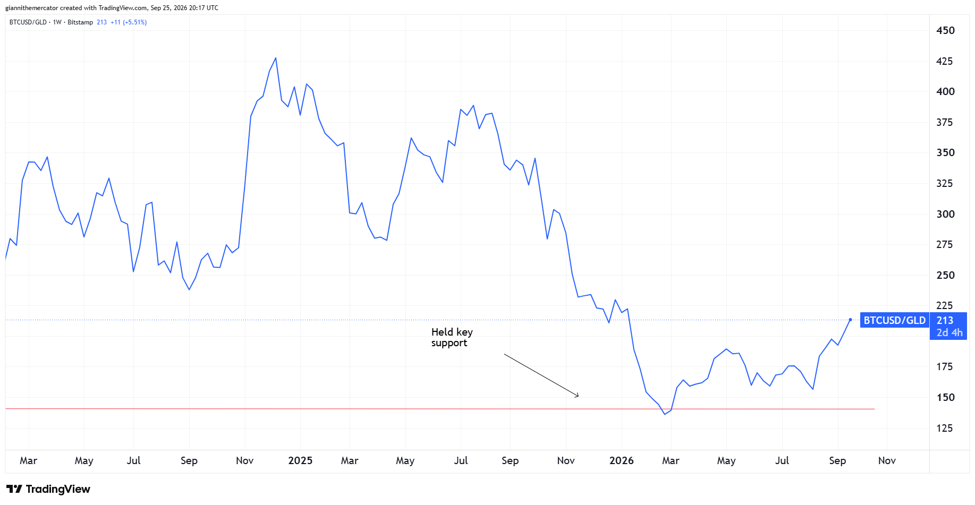
The battle of the alternative assets is accelerating, and it’s triggered a major shift in favor of crypto as of late. The chart below shows the ratio between Bitcoin (BTC) and gold (GLD).
In 2025, precious metals were all the rage. This year, they’ve both spent quite a bit of time down in the doldrums as they built new long-term technical bases. Note how this ratio bounced off technical support and is starting to move higher in favor of Bitcoin.
There’s now been a series of higher-highs and higher-lows in this ratio. This doesn’t mean that gold is bearish – far from that. It just means that Bitcoin is more likely to outperform, and warrants an overweight position relative to gold.
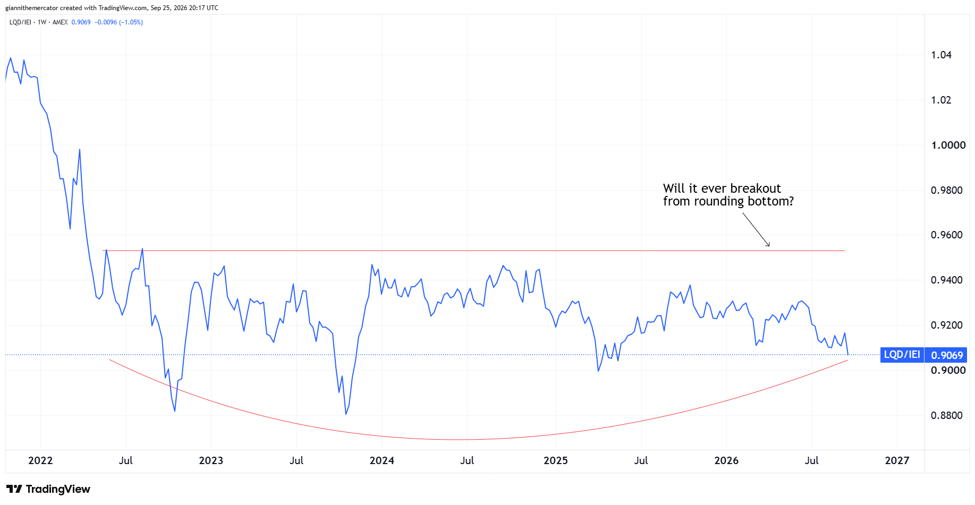
Once Again, Spreads Recovered (Sector ETF: LQD/IEI)
As long as I’ve been in the markets, I’m endlessly amazed at how powerful credit spreads are. I believe that the bond market is smarter than the stock market, and that cracks form in credit before they spread to stocks.
I have the ratio between investment-grade corporate debt (LQD) stacked up against 3-7 Year Treasuries (IEI). You’ll notice how it turned up sharply in recent weeks, only to drop hard again. It desperately needs to turn around this week.
Simply put, you’re not going to get any serious equity market volatility if this ratio is trending higher. It doesn’t matter what interest rates are doing. It just matters what their relationship to one another is. Liquidity remains stable.
Cryptocurrency
I want to have another look at Solana this week. It’s now confirmed a new uptrend, and the end of the bear market. This observation can be made thanks to the series of higher-highs and higher-lows that printed over the past few months.
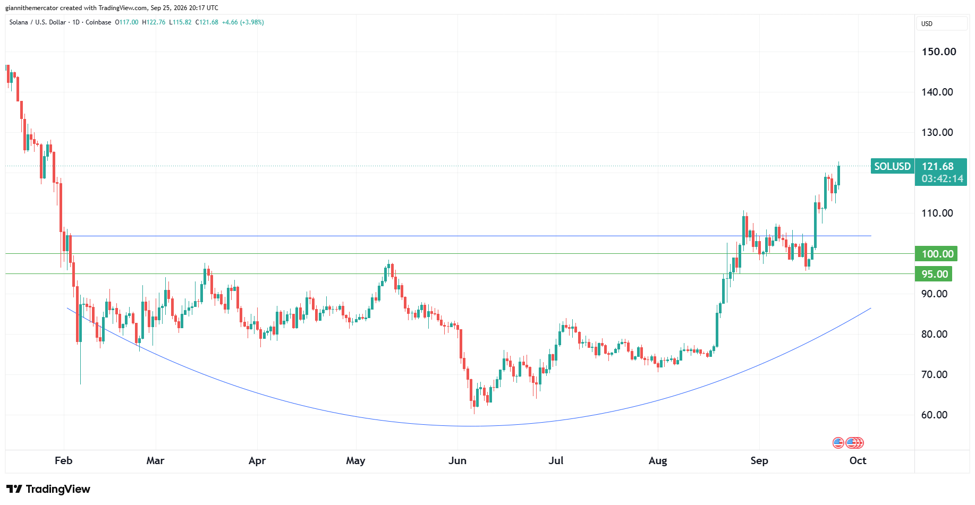
Bigger picture, it also broke out from a massive rounding bottom formation. This pattern is projecting a move as high as 125.00-130.00 at least, but at that point, it seems like little would be stopping Solana from rallying to 150.00-155.00.
There’s now tremendous support at 95.00-100.00. Above there, little reason exists to be bearish in Solana. Right now, it’s basically a battle between Solana and Ethereum for access to Wall Street’s new financial plumbing.
Legal Disclosures:
This communication is provided for information purposes only.
This communication has been prepared based upon information, including market prices, data and other information, from sources believed to be reliable, but Benzinga does not warrant its completeness or accuracy except with respect to any disclosures relative to Benzinga and/or its affiliates and an analyst’s involvement with any company (or security, other financial product or other asset class) that may be the subject of this communication. Any opinions and estimates constitute our judgment as of the date of this material and are subject to change without notice. Past performance is not indicative of future results. This communication is not intended as an offer or solicitation for the purchase or sale of any financial instrument. Benzinga does not provide individually tailored investment advice. Any opinions and recommendations herein do not take into account individual client circumstances, objectives, or needs and are not intended as recommendations of particular securities, financial instruments or strategies to particular clients. You must make your own independent decisions regarding any securities, financial instruments or strategies mentioned or related to the information herein. Periodic updates may be provided on companies, issuers or industries based on specific developments or announcements, market conditions or any other publicly available information. However, Benzinga may be restricted from updating information contained in this communication for regulatory or other reasons. Clients should contact analysts and execute transactions through a Benzinga subsidiary or affiliate in their home jurisdiction unless governing law permits otherwise.
This communication may not be redistributed or retransmitted, in whole or in part, or in any form or manner, without the express written consent of Benzinga. Any unauthorized use or disclosure is prohibited. Receipt and review of this information constitutes your agreement not to redistribute or retransmit the contents and information contained in this communication without first obtaining express permission from an authorized officer of Benzinga. Copyright 2022 Benzinga. All rights reserved.
Login to comment