Qualcomm Inc (NASDAQ:QCOM) may be one of the biggest semiconductor companies in the business but its latest financial disclosure had investors ducking for cover. Although the actual fiscal first-quarter print was solid, QCOM stock fell heavily on lower-than-expected forward guidance, which seemingly reflected the challenges of rising competition. Subsequently, the smart money has prioritized downside volatility protection in the options market, leaving call options relatively cheap.
On paper, Qualcomm posted earnings per share of $3.50 on revenue of $12.25 billion, beating the consensus target of $3.15 and $12.22 billion, respectively. These figures also expanded upon the year-ago quarter's results of earnings of $3.41 per share and a top-line print of $11.67 billion.
Unfortunately, investors were less enthused about the current quarter's sales and earnings guidance, which saw the tech giant fall short of analysts' consensus estimates. One of the biggest challenges appeared to stem from competitive pressures in the handset market, with Chinese OEMs slashing their forecasts. This dynamic forced Qualcomm to guide down expectations, contributing to the volatility in QCOM stock.
Not surprisingly, the latest results forced hedging activity in the options market. Specifically, volatility skew, which is a screener that identifies implied volatility (IV) — a stock's potential kinetic output — across the strike price spectrum of a given options chain reveals a prioritization of downside insurance.
For example, for the March 20 expiration date, the curvature of the skew rises on both ends of the price spectrum, with put IV priced higher than calls. This setup suggests that the main theme among smart money traders is to protect against additional potential downside volatility, particularly with mechanical shorts via deep in-the-money (ITM) puts.
While the hedging activity is more than understandable given that QCOM stock is now down 19% on a year-to-date basis, it has also made bullish expression through call options relatively cheap. If there's a legitimate reason to consider going long QCOM, it could be a legitimate discount.
Laying Out The Trading Parameters For QCOM Stock
While we may have an understanding of the general smart money sentiment of Qualcomm stock, we're still at a loss as to how this may be expressed in actual outcomes. For that, we may turn to the Black-Scholes-derived expected move calculator. Wall Street's standard mechanism for pricing reveals that for the March 20 expiration date, QCOM may range between $127.55 and $149.63. This estimate represents a 7.96% high-low spread relative to the spot price.
Where does this dispersion come from? Black-Scholes assumes a world where stock market returns are lognormally distributed. Under this framework, the above range represents where QCOM stock may symmetrically fall one standard deviation away from spot (while accounting for volatility and days to expiration).
Basically, Black-Scholes is saying that in 68% of cases, we would expect QCOM stock to trade roughly between $128 and $150 over the next 42 days. Reasonable? I'd say so. After all, it would take an extraordinary catalyst for a major name like QCOM to move beyond one standard deviation. That said, it's not the most instructive piece of information because of the peak-to-trough spread of 17.3%.
Quite frankly, we have reached the limit of first-order analyses. While we haven't looked at unusual options activity, the reality is that persistently aberrant trades would show up in the volatility skew. And implied volatility is the main driver of the Black-Scholes model.
Basically, Qualcomm stock is a shipwrecked survivor and first-order analyses have identified that the SOS signal pinged somewhere in a large patch of the Pacific Ocean. That's informative but even the search radius is a sizable area. Given limited resources for a search-and-rescue (SAR) attempt, we have to use math to best estimate where the survivor is likely to be found.
That's where the Markov property comes into frame.
Using Science To Trade Qualcomm Stock
Under Markov, the future state of a system depends entirely on the present state. In other words, forward probabilities should not be calculated independently but be assessed under context. In the above SAR analogy, we can't just assume survivor drift patterns independent of context, like ocean currents or wind speed. The presence of choppy waters or calm waters will likely have a dramatic effect on where the survivor is likely to be found.
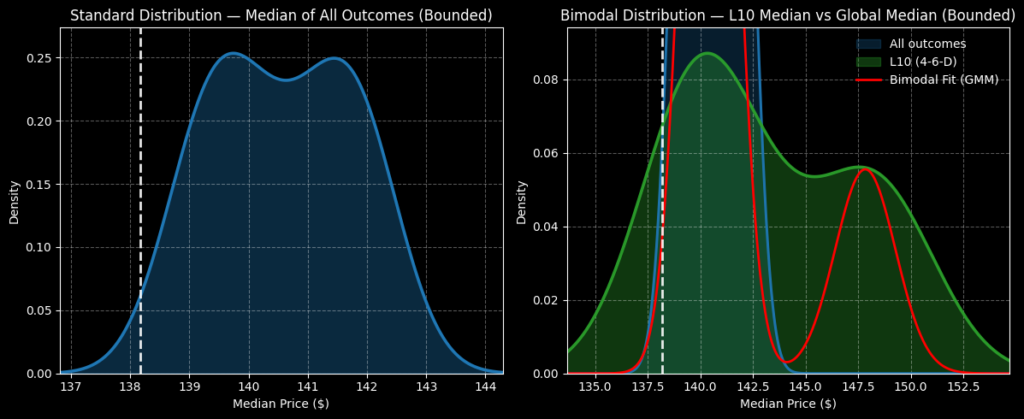
This basic, scientific reality explains why I categorize price action as discretized sequences. For example, in the last 10 weeks, QCOM stock printed only four up weeks, leading to an overall downward slope. There's nothing special about this 4-6-D sequence, per se. However, extending the SAR analogy, the 4-6-D represents a specific type of ocean current. Based on prior drift patterns associated with this quantitative signal, we can better estimate where the survivor is likely to be found.
Let's pause here for a moment. This process of pattern recognition — or perhaps more formally enumerative induction — is not philosophically airtight. Just because a pattern has been established does not mean that in the next move, the pattern must be respected. Still, in a world of uncertainties, this Bayesian-inspired methodology is arguably the best mechanism we have available.
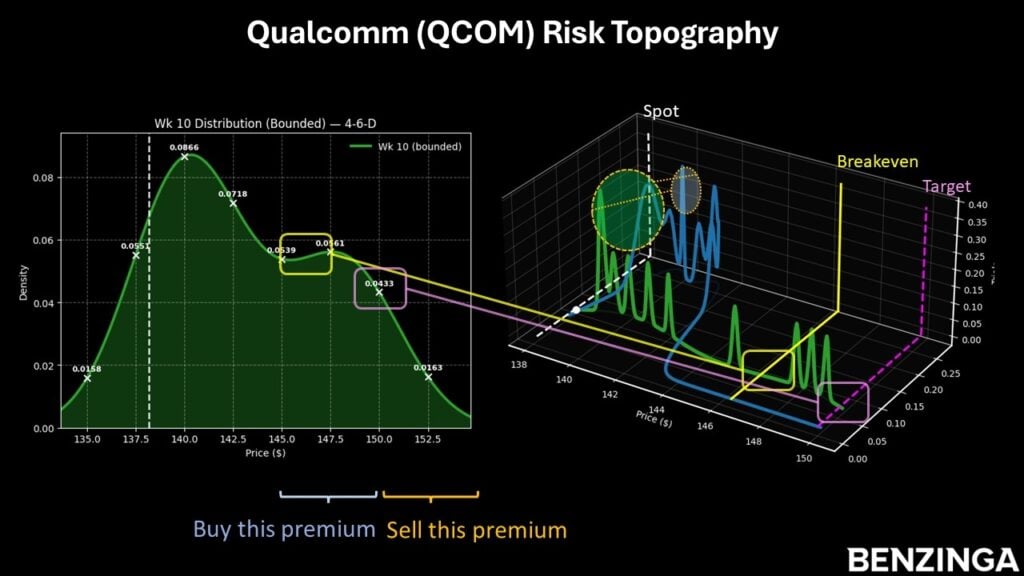
If you accept the premise, over the next 10 weeks, QCOM stock will likely trade between $132 and $158. Probability density will likely peak near $140. However, Bayesian-inspired inference suggests that density may stay relatively elevated to around $150 before a noticeable drop-off occurs.
Given how the probabilities may stack up, I'm liking the 145/150 bull call spread expiring March 20. This wager requires QCOM stock to rise through the $150 strike at expiration, which is ambitious but within reason contextually. If the second-leg strike is triggered, the maximum payout would be nearly 229%. Breakeven would land at $146.52, helping with the trade's probabilistic credibility.
The opinions and views expressed in this content are those of the individual author and do not necessarily reflect the views of Benzinga. Benzinga is not responsible for the accuracy or reliability of any information provided herein. This content is for informational purposes only and should not be misconstrued as investment advice or a recommendation to buy or sell any security. Readers are asked not to rely on the opinions or information herein, and encouraged to do their own due diligence before making investing decisions.
Image: Shutterstock
- No comments yet. Be the first to comment!