Market Overview
Indices were down again last week but in many ways, they masked the real carnage underneath the surface. It's mainly because technology and financials fared better than other sectors, save for energy, which was still bid. The indices were led lower again by the Dow Jones Industrial Average, which finished down 2.11% on the week. The S&P 500 and Nasdaq were down 1.90% and 2.09%, respectively. The other silver lining was cryptocurrencies, which held up better than stocks. Metals got dumped with Treasuries as the global margin call continued. Interestingly, WTI crude oil finished lower while Brent crude oil was bid.
Stocks I Like
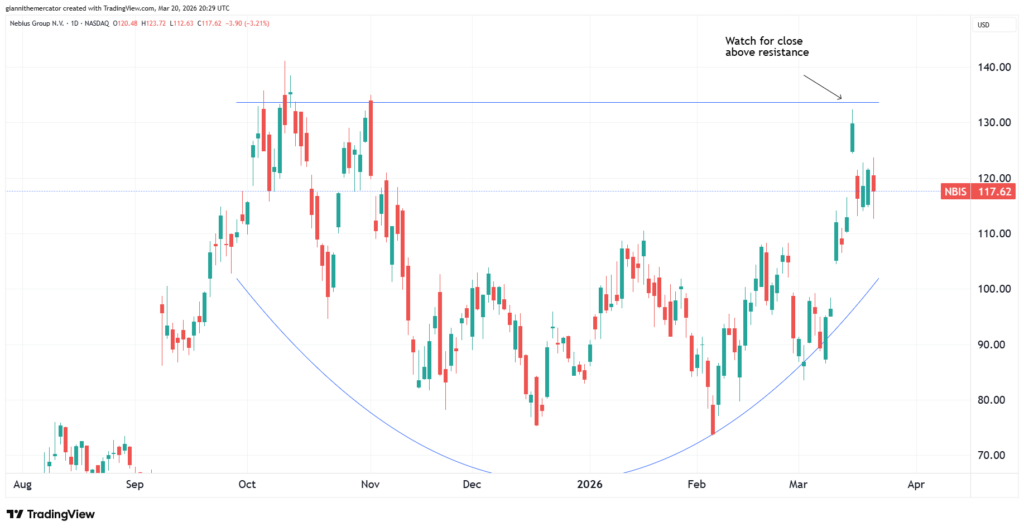
Nebius (NASDAQ:NBIS) – 70% Return Potential
What's Happening
- Nebius Group N.V. (NBIS) is a leading technology company building full-stack AI infrastructure, including large-scale GPU clusters, cloud platforms, and developer tools to power artificial intelligence workloads worldwide, offering investors exposure to the rapidly growing artificial intelligence and high-performance computing sector with a focus on scalable infrastructure and innovative solutions for generative AI and advanced applications.
- The company had revenue of $227.7 but a loss of $249.6 million in the last quarter.
- The valuation in NBIS is sky-high. P/E is at 1133, Price-to-Sales is at 62.01, and EV to EBITDA is at 62.46.
- At a technical level, NBIS has shaped up nicely within a multi-month saucer formation. This has the potential to lead to another major leg higher in this name.
Why It's Happening
- Nebius Group N.V. is capitalizing on the explosive AI infrastructure boom after signing a transformative multi-year agreement with Meta Platforms valued at up to $27 billion. This landmark deal validates its full-stack GPU cloud capabilities and positions the company as a critical supplier of large-scale computing power to the world’s leading AI developers.
- Complete strategic transformation from its former Yandex identity into a pure-play AI infrastructure company has unlocked tremendous focus and value. By building advanced data centers, cloud platforms, and developer tools across Europe and North America, Nebius is carving out a leadership position in the race to supply next-generation AI compute capacity.
- Toloka’s data labeling platform provides an essential competitive advantage by supplying high-quality training data for generative AI models. This vertical integration strengthens its ecosystem and creates diversified, recurring revenue streams that support its core infrastructure growth.
- Diversified portfolio including Avride’s autonomous driving technology and TripleTen’s edtech platform adds multiple growth engines beyond core AI cloud services, tapping into robotics, mobility, and talent development markets that align with the broader AI revolution.
- NBIS has a short interest of over 20%, which sets it up for a squeeze higher.
- Analyst Ratings:
- DA Davidson: Buy
- BWS Financial: Buy
- Citigroup: Buy
My Action Plan (70% Return Potential)
- I am bullish on NBIS above $100.00-$105.00. My upside target is $200.00-$205.00.
Spyre Therapeutics (NASDAQ:SYRE) – 82% Return Potential

What's Happening
- Spyre Therapeutics, Inc. (SYRE) is a leading clinical-stage biotechnology company developing next-generation monoclonal antibody therapies and innovative combinations for inflammatory bowel disease (IBD) and other immune-mediated diseases, offering investors exposure to the rapidly growing immunology and precision medicine sector with a focus on targeted pathways such as α4β7 integrin, TL1A, and IL-23.
- The last quarterly report had no revenue and a loss of $62.53 million.
- Valuation is steep in SYRE with its Book Value coming in at just 7.12.
- From a technical standpoint, SYRE looks to be breaking out from a bullish pennant/flag formation. These are powerful momentum patterns that can lead to explosive price moves.
Why It's Happening
- Spyre Therapeutics is pioneering next-generation long-acting antibodies to redefine care for inflammatory bowel disease and rheumatic conditions, leveraging validated targets like α4β7, TL1A, and IL-23 with extended half-life technology and innovative combinations that promise fewer injections and superior patient convenience in chronic, high-burden diseases affecting millions worldwide.
- Accelerated clinical momentum across its SKYLINE platform trial in ulcerative colitis fuels Spyre's transformational narrative, with enrollment for SPY001 completed ahead of schedule and Part A proof-of-concept readouts now expected to begin in Q2 2026—marking the start of a landmark year of data that could validate its approach and accelerate paths toward pivotal studies.
- "6 in '26" proof-of-concept readouts create a compelling catalyst calendar, with additional data anticipated across the SKYWAY basket trial in rheumatoid arthritis, psoriatic arthritis, and axial spondyloarthritis, alongside the RA sub-study now advanced to Q3 2026, positioning Spyre to generate multiple clinical milestones that highlight the breadth and potential of its diversified pipeline.
- Robust financial foundation with nearly $757 million in cash, cash equivalents, and marketable securities as of year-end 2025 provides a runway well into the second half of 2028, enabling focused execution on clinical programs without near-term financing pressure and supporting steady advancement toward potential commercialization in large-addressable markets.
- Strategic leadership enhancements, including the appointment of an experienced Chief Commercial Officer, signal Spyre's proactive shift toward building commercial readiness alongside its clinical progress, reinforcing its story as a mission-driven biotech poised to deliver meaningful new options for patients living with debilitating inflammatory diseases.
- SYRE is a candidate for a short squeeze with over 15% of its floated shares being sold short.
- Analyst Ratings:
- BTIG: Buy
- Wells Fargo: Overweight
- Mizuho: Outperform
My Action Plan (82% Return Potential)
- I am bullish on SYRE above $37.00-$38.00. My upside target is $75.00-$80.00.
Red Cat Holdings (NASDAQ:RCAT) – 95% Return Potential

What's Happening
- Red Cat Holdings, Inc. (RCAT) is a leading developer of unmanned aircraft systems (UAS) and robotic technologies, specializing in advanced drones, AI-powered software, and mission-critical solutions for defense, public safety, and government applications, offering investors exposure to the rapidly growing drone technology and autonomous systems sector with a focus on military-grade innovation and tactical capabilities.
- The company's latest quarterly report had revenue of $9.65 million but no earnings.
- Valuation in RCAT is high. Price-to-Sales is 66.20 while Book Value is just 1.91.
- From a charting perspective, RCAT has coiled nicely into a cup and handle formation. If it clears resistance, look out above.
Why It's Happening
- Red Cat Holdings Inc. is experiencing explosive revenue growth as it transitions to full-scale mass production of U.S.-made military drones, with preliminary Q4 2025 revenue projected between $24 million and $26.5 million—representing an 1,842% increase year-over-year—driven by the successful ramp-up of its new factories and execution on major U.S. Army Short Range Reconnaissance contracts. This shift from development to high-volume delivery positions Red Cat as a critical supplier meeting surging demand for battlefield-ready unmanned systems.
- Strategic expansion into multi-domain defense capabilities is transforming Red Cat from a drone specialist into a comprehensive provider of air, land, and maritime solutions. The recent alliance with Allen Control Systems integrates AI-enabled autonomous counter-drone and precision strike technology, while the new Blue Ops maritime initiative introduces unmanned surface vessels, unlocking broader opportunities across modern warfare domains and creating a unified ecosystem for defense customers.
- Accelerated factory buildout and production scaling lay the groundwork for sustained momentum heading into 2026. With three new manufacturing facilities now online and geared toward small-drone output, Red Cat is poised to deliver on its vision of becoming a high-volume producer, directly addressing Pentagon priorities for domestic drone manufacturing and enabling rapid fulfillment of both domestic and international orders.
- Growing role in national security programs strengthens Red Cat's position amid heightened global tensions and defense spending. Participation in initiatives like the U.S. Army's Drone Dominance Program and expanding Asia-Pacific contracts reflect its alignment with policy-driven demand for trusted, American-made unmanned systems, building long-term backlog and visibility in a market increasingly focused on resilient, sovereign supply chains.
- Leadership in autonomous and counter-drone innovation cements Red Cat's narrative as a forward-thinking defense innovator. By advancing AI-integrated platforms and unmanned maritime capabilities, the company is meeting evolving battlefield needs for intelligence, surveillance, and protection—positioning it to capture a larger share of the rapidly expanding military drone and autonomous systems market in the years ahead.
- The stock could experience a notable short squeeze as +20% of its floated shares are being sold short.
- Analyst Ratings:
- Ladenburg Thalmann: Buy
- Needham: Buy
- Northland Capital Markets: Outperform
My Action Plan (95% Return Potential)
- I am bullish on RCAT above $11.00-$12.00. My upside target is $28.00-$30.00.
Market-Moving Catalysts for the Week Ahead
Positioning for a Cataclysm
Fear levels are rising faster and faster, and market participants are positioning for it. Global energy supplies have been seriously disrupted, and the spread between WTI oil (U.S. based) and Brent oil (Internationally based) is at decade-plus highs.
The positioning in markets reflects this as well. The total put:call ratio has surged in favor of puts, as both traders and investors rush to purchase protection. This confirms the fear in the market, but it's often observed at key market inflection points.
The thing about fear is that it paralyzes most traders. There's a common phrase to, "Buy when there's blood in the streets," but few actually manage to do so. This could easily be one of those opportunities now – we've been looking for the best buying opportunity of the year – and this may be it.
Powell is Lost
Needless to say, Fed Chair Jerome Powell didn't say much following the Fed's decision to keep rates unchanged last week. I can't say that I expected anything more out of the outgoing Fed Chair, but it does highlight some of the confusion at the central bank.
First and foremost, the Fed is trapped in a very nasty place now. The circumstances that we find ourselves in would be helped by rate cuts, but the problem is that you really can't cut rates after an oil price surge just like we saw.
To his credit, Powell actually commented on the lack of private sector jobs being created. Normally, the Fed's response would be to lower rates. This is why they're trapped – if they lower rates, inflation accelerates. If they raise rates, the economy gets hammered even harder.
Sector & Industry Strength
When you step back and consider that just over half of the S&P sectors are positive year-to-date, it paints a pretty stark picture. To make the situation even more challenging, all of the growth sectors like tech (XLK), communications (XLC), and consumer discretionary (XLY) are negative on the year.
Not to mention, financials (XLF) are down double digits on the year. This is the second-largest sector behind tech, which means the top two, and most consequential sectors for the market are in negative territory.
Energy (XLE) continues to absolutely dominate the tape year-to-date. There's a +40% performance spread between XLE and XLF. Consumer staples (XLP) are holding strong in second place despite getting sold hard last week too. Bulls still have work to do.
| 1 week | 3 Weeks | 13 Weeks | 26 Weeks |
| Energy | Energy | Energy | Energy |
Editor's Note: The inflationary flush continues.
A Dangerous Game (Sector ETF: DBC/SPY)
Inflation remains the Achilles' heel of the U.S. economy. It's time to take a look at the ratio between a basket of commodities (DBC) and the S&P 500. This is a key ratio to measure inflationary momentum specifically.
The trend in this ratio has been downward since topping out in the summer of 2022. But the recent surge actually took out the high from 2025, which signals the integrity of the downtrend in favor of stocks is broken.
This development gives commodities an advantage in the near-term. I'm also monitoring a potential breakout from a broadening wedge formation, which may confirm a reversal. If this ratio keeps trending higher, it's going to present issues for stocks and the economy-at-large.

Discount Window for Tech? (Sector ETF: XLK/SPY)
Despite the headwinds in energy, the signs of a renewed bull market continue to climb. I have the ratio between the largest and most important sector in the market, technology (XLK), against the S&P 500 (SPY).
Basically, when this ratio rises, it's a tailwind for stocks. The tech sector was the first to top out back in October and it's actually gone the longest without a 52-week high compared to the other market sectors. But this ratio here is signaling that could change soon.
The breakout from the wedge formation confirmed a technologically-dominant stock market regime. The ratio then came back down to retest former-resistance-turned-support, and looks to have formed a higher-low. Trends like these often start quietly – the biggest opportunity in the market right now remains in technology.

What's Up With Junk Debt? (Sector ETF: HYG/IEI)
There are rumors swirling of a massive private credit crisis brewing, and while the headlines may be scary, the bond market seems to be largely shrugging it off, especially when you look at what's happening in junk debt.
There's actually been remarkable resiliency in junk debt (HYG) compared to 3-7 Year Treasuries (IEI). Normally, if stocks were about to implode, we'd see a big selloff in junk debt, which would correspond to a big drop in this ratio.
Interestingly, it's high quality corporate debt that has fared much worse. Bigger picture, we're still seeing this ratio consolidate near the highs of the saucer formation. If this clears resistance, look for liquidity conditions to improve significantly.

Cryptocurrency
Let's shift gears back to Ethereum this week. There's been a nice rally in cryptocurrencies over the past couple of weeks despite the broader market volatility. Of course, this could just be a dead-cat bounce within a greater downtrend, but there are signs that momentum is starting to shift.

It's still very early but we did print a higher-high and a higher-low recently, which is often a signal that the trend is starting to shift bullish. However, bigger picture, a lower-high could have easily been complete, which could keep the bears emboldened through time.
Prices continue to trade within the descending price channel too. These are continuation patterns and as long as they remain within the channel, don't be surprised to see it keep dropping. If it closes above 2600-2800, it would signal bulls finally flipped it. Otherwise, stay open-minded for a drop to 1300-1400.
Legal Disclosures:
This communication is provided for information purposes only.
This communication has been prepared based upon information, including market prices, data and other information, from sources believed to be reliable, but Benzinga does not warrant its completeness or accuracy except with respect to any disclosures relative to Benzinga and/or its affiliates and an analyst’s involvement with any company (or security, other financial product or other asset class) that may be the subject of this communication. Any opinions and estimates constitute our judgment as of the date of this material and are subject to change without notice. Past performance is not indicative of future results. This communication is not intended as an offer or solicitation for the purchase or sale of any financial instrument. Benzinga does not provide individually tailored investment advice. Any opinions and recommendations herein do not take into account individual client circumstances, objectives, or needs and are not intended as recommendations of particular securities, financial instruments or strategies to particular clients. You must make your own independent decisions regarding any securities, financial instruments or strategies mentioned or related to the information herein. Periodic updates may be provided on companies, issuers or industries based on specific developments or announcements, market conditions or any other publicly available information. However, Benzinga may be restricted from updating information contained in this communication for regulatory or other reasons. Clients should contact analysts and execute transactions through a Benzinga subsidiary or affiliate in their home jurisdiction unless governing law permits otherwise.
This communication may not be redistributed or retransmitted, in whole or in part, or in any form or manner, without the express written consent of Benzinga. Any unauthorized use or disclosure is prohibited. Receipt and review of this information constitutes your agreement not to redistribute or retransmit the contents and information contained in this communication without first obtaining express permission from an authorized officer of Benzinga. Copyright 2022 Benzinga. All rights reserved.
Login to comment