The March Consumer Price Index (CPI) report, scheduled for release at 8:30 a.m. ET on Friday, will deliver the first hard data point on how the Iran war has reshaped the inflation outlook. Wall Street expects the answer to be ugly.
Wall Street consensus calls for headline CPI to jump 0.9% in March on a monthly basis, which would mark the steepest monthly rise since June 2022.
That surge is almost entirely a function of one variable: energy prices have spiked more than 10% in a single month. Why? The conflict in Iran disrupted oil flows through the Strait of Hormuz.
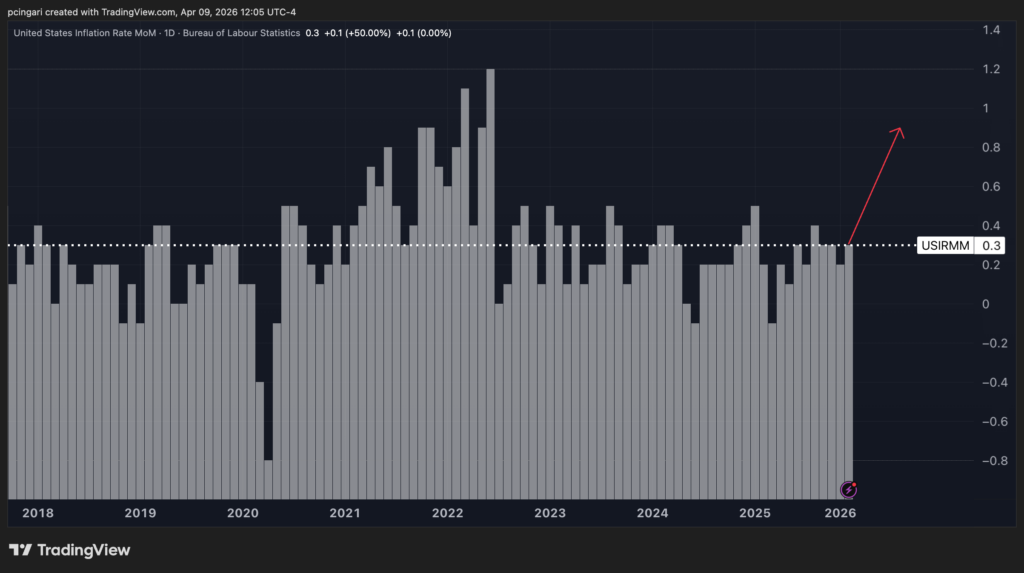
Inflation does not usually move this fast. Since the post-2009 recovery, there have been only five months in which the monthly CPI reading hit 0.9% or higher.
Every single one of them landed between October 2021 and June 2022, at the peak of the post-pandemic inflation surge.
March 2026 could likely join that short, painful list.
And it’s going to get worse for other sectors. After all, energy costs feed into transportation, manufacturing, and utility costs, which reinforce price rises across virtually all markets. As a result, conflict‑induced supply shocks ripple through the economy.
March Inflation Preview: What Wall Street Expects
President Donald Trump, during a January speech in Davos, Switzerland, claimed that “inflation has been defeated.”
However, Bank of America economists forecast a 0.91% month-over-month surge in headline CPI, driven by a 10.6% jump in energy prices.
Core CPI — which strips out food and energy to capture underlying price pressures — is expected to come in at a cooler 0.26% for the month, implying a 2.7% year-over-year rate.
“This month is likely too early to see significant signs of the Iran war in the core data. That said, we will be watching airfares and delivery services to see if there are any early signs of higher oil prices seeping through to the broader basket,” said Bank of America economist Stephen Juneau in a preview note.
Goldman Sachs similarly forecasts the monthly jump at 0.87%, which will push the annual rate from 2.4% in February to 3.3% in March, in line with consensus estimates.
The Oil Shock Transmission To Inflation
The arithmetic of an oil shock into consumer prices works through two channels.
The direct channel — gasoline, utilities, jet fuel — hits CPI energy in the month the price move occurs, which is what Friday’s report will capture.
The indirect channel takes longer: higher trucking and logistics costs, elevated manufacturing input prices, and airline surcharges that pass through to leisure and business travelers over subsequent months.
Goldman’s rules of thumb are explicit on the math: a sustained 10% increase in oil prices boosts headline CPI by 25–30 basis points and core CPI by just 4 basis points.
That means Friday’s print is largely a story about energy, not embedded inflation.
The real test will come in April and May data, when Goldman and Bank of America expect tariff effects and oil passthrough to begin surfacing in goods categories and services.
The Historical Playbook: When CPI Jumps, These Stocks Tumble
In the post-2009 era, headline CPI has risen 0.9% or more month-over-month on only five occasions — all of them during the peak inflation cycle of late 2021 and mid-2022:
- November 10, 2021 — October 2021 CPI (0.9% m/m): first shock reading confirming inflation was not transitory
- December 10, 2021 — November 2021 CPI (0.9% m/m): second consecutive hot print, forcing Fed pivot narrative
- April 12, 2022 — March 2022 CPI (1.1% m/m): first inflation reading after the Russian invasion of Ukraine
- June 10, 2022 — May 2022 CPI (0.9% m/m): confirmation of the energy shock
- July 13, 2022 — June 2022 CPI (1.2% m/m): final surge before inflation peaked
Each release triggered an identifiable market rotation.
Using Benzinga Pro‘s Movers data filtered to companies with market caps above $50 billion, the consistent pattern across those five events was sharp selling in high-multiple growth, financials and cyclicals.
November 10, 2021 — October CPI Release: Worst Performers
| Company (Ticker) | Change |
|---|---|
| Lucid Group Inc. (NASDAQ:LCID) | –9.00% |
| Coinbase Global Inc. (NASDAQ:COIN) | –8.06% |
| DocuSign Inc. (NASDAQ:DOCU) | –7.09% |
| MercadoLibre Inc. (NASDAQ:MELI) | –6.89% |
| Advanced Micro Devices Inc. (NASDAQ:AMD) | –6.08% |
| Shopify Inc. (NYSE:SHOP) | –5.29% |
| Blackstone Inc. (NYSE:BX) | –4.72% |
| Uber Technologies Inc. (NYSE:UBER) | –4.68% |
| Fortinet Inc. (NASDAQ:FTNT) | –4.56% |
| Cloudflare Inc. (NYSE:NET) | –4.42% |
December 10, 2021 — November CPI Release: Worst Performers
| Company (Ticker) | Change |
|---|---|
| Sea Ltd. (NYSE:SE) | –6.70% |
| Moderna Inc. (NASDAQ:MRNA) | –5.57% |
| DoorDash Inc. (NYSE:DASH) | –4.18% |
| Coinbase Global Inc. | –3.09% |
| Snap Inc. (NYSE:SNAP) | –2.96% |
| Citigroup Inc. (NYSE:C) | –2.29% |
| Shopify Inc. (NYSE:SHOP) | –2.26% |
| Uber Technologies Inc. (NYSE:UBER) | –2.24% |
| Morgan Stanley (NYSE:MS) | –2.15% |
| Bristol-Myers Squibb Co. (NYSE:BMY) | –2.09% |
April 12, 2022 — March CPI Release: Worst Performers
| Company (Ticker) | Change |
|---|---|
| Shopify Inc. (NYSE:SHOP) | –4.44% |
| Danaher Corp. (NYSE:DHR) | –3.56% |
| HSBC Holdings plc (NYSE:HSBC) | –3.21% |
| Sanofi S.A. (NASDAQ:SNY) | –3.03% |
| Novo Nordisk A/S (NYSE:NVO) | –2.94% |
| NetEase Inc. (NASDAQ:NTES) | –2.92% |
| AstraZeneca plc (NASDAQ:AZN) | –2.86% |
| Progressive Corp. (NYSE:PGR) | –2.72% |
| HDFC Bank Ltd. (NYSE:HDB) | –2.66% |
| Intercontinental Exchange Inc. (NYSE:ICE) | –2.61% |
June 10, 2022 — May CPI Release: Worst Performers
| Company (Ticker) | Change |
|---|---|
| Booking Holdings Inc. (NASDAQ:BKNG) | –7.59% |
| Wells Fargo & Co. (NYSE:WFC) | –6.28% |
| BlackRock Inc. (NYSE:BLK) | –6.18% |
| Blackstone Inc. | –6.16% |
| Nvidia Corp. (NASDAQ:NVDA) | –5.95% |
| Airbnb Inc. (NASDAQ:ABNB) | –5.88% |
| PayPal Holdings Inc. (NASDAQ:PYPL) | –5.72% |
| Amazon.com Inc. (NASDAQ:AMZN) | –5.60% |
| The Sherwin-Williams Co. (NYSE:SHW) | –5.58% |
July 13, 2022 — June CPI Release: Worst Performers
| Company (Ticker) | Change |
|---|---|
| Zoetis Inc. (NYSE:ZTS) | –3.43% |
| Philip Morris International Inc. (NYSE:PM) | –3.39% |
| FedEx Corp. (NYSE:FDX) | –3.12% |
| RTX Corp. (NYSE:RTX) | –2.88% |
| UnitedHealth Group Inc. (NYSE:UNH) | –2.56% |
| Blackstone Inc. (NYSE:BX) | –2.54% |
| Illinois Tool Works Inc. (NYSE:ITW) | –2.41% |
| Abbott Laboratories (NYSE:ABT) | –2.37% |
| HDFC Bank Ltd. (NYSE:HDB) | –2.37% |
| Alphabet Inc. (NASDAQ:GOOG) | –2.34% |
The pattern holds across all five events: high-valuation growth names — crypto exchanges, software platforms, e-commerce — bore the steepest losses on the first two November and December 2021 prints, when the inflation surprise was freshest.
By mid-2022, the damage had rotated into financials and travel names, as the market repriced both rate expectations and economic slowdown risk.
Notably, Blackstone appeared on three of the five worst-performing lists, a signal of how persistently higher-for-longer rates are compressing alternative asset managers.
What Investors Should Watch Friday
The divergence between a hot headline print and a relatively contained core reading creates a tactical ambiguity.
Bank of America will be watching for early signs of oil pass-through in airfares and delivery services — the categories most sensitive to jet fuel and diesel costs.
Goldman Sachs flags tariff-exposed goods such as recreation, household furnishings and personal care as secondary pressure points where inflation could surprise to the upside independently of oil.
The open question heading into Friday is not whether March CPI will be hot — it will be.
The real unknown is whether the data confirms a geopolitically-driven one-month spike that fades as oil stabilizes, or whether it marks the first data point in a new inflation regime where the Iran war has durably repriced the cost of everything that moves.
But markets may not have that luxury to wait.
Image: Shutterstock
Login to comment