Bitcoin (CRYPTO: BTC) has lost momentum over the past few days. It retreated to $78,140 in Saturday, down from this month's high of $82,553. Its has formed some alarming technical patterns, pointing to a bearish breakout as exchange-traded fund (ETF) outflows rise and as futures open interest drops.
Bitcoin Price Drops As ETF Outflows Rise, Liquidations Jump
BTC’s price could be at risk of more downside in the near future as third-party data points to waning demand. Spot Bitcoin ETFs suffered a $1 billion outflow this week, ending a six-week streak of inflows. As a result, the funds have now had net inflows of $250 million this month.
Increasing Bitcoin ETF outflows is a sign that institutional demand is easing. Indeed, data shows that the Coinbase Premium Index has remained in the red since April 28. A higher index means that demand among American investors is rising.
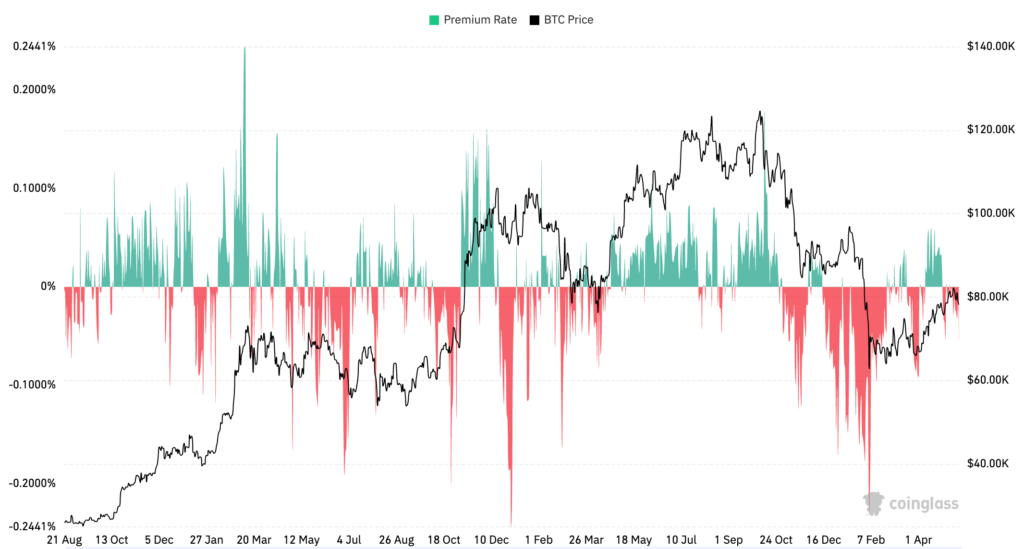
Bitcoin Coinbase Premium Index
More data shows that the futures open interest has started falling. Its open interest dropped to $58 billion today from this month's high of $64 billion. Falling open interest is a sign that investors are closing their active derivatives positions without opening new ones.
At the same time, bullish Bitcoin positions suffered the biggest liquidation event since March 27 as it dropped below key support levels. Rising bullish liquidations are risky because they happen when there is forced selling of positions.
Bitcoin has lost momentum as concerns about the Federal Reserve have remained. Recent macro data showed that the headline Consumer Price Index jumped to 3.8%, moving further away from the Fed's target of 2.0%.
Another report showed that the headline Producer Price Index jumped to 6.0%. As a result, Wall Street analysts expect that the Fed will find it hard cutting rates this year.
BTC Price Has Formed Alarming Chart Patterns
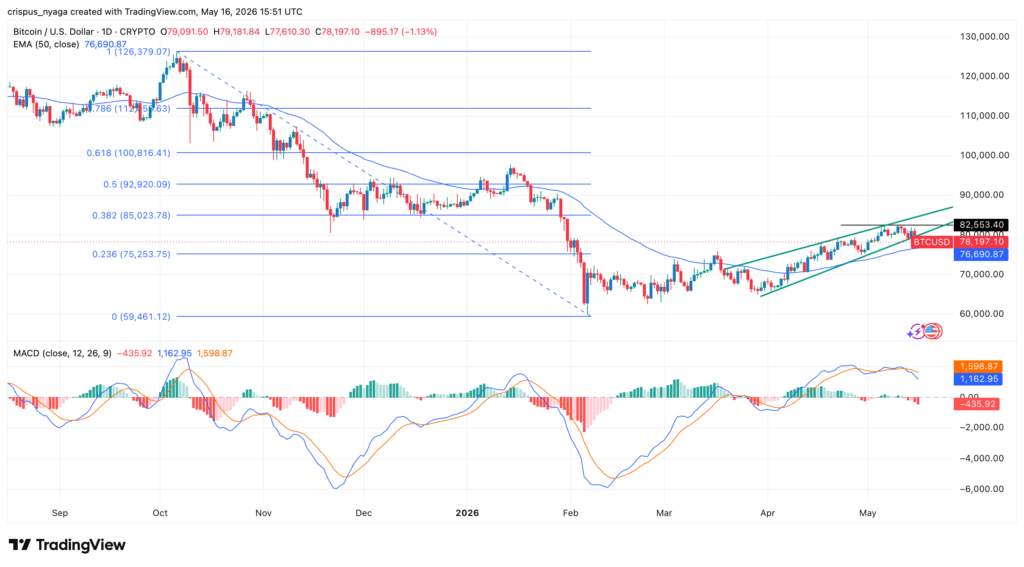
Technicals suggest that Bitcoin price may continue falling in the coming days. For one, the coin has failed to move above the 200-day moving average, which tends to confirm bullish reversals.
Bitcoin price has also formed a rising wedge pattern. This pattern is made up of two rising and converging trendlines, with a bearish breakout happening when the two lines are nearing their convergence.
Additionally, the two lines of the Moving Average Convergence and Divergence (MACD) crossed each other and are pointing downwards. Its histograms have moved below the zero line.
Therefore, the most likely Bitcoin price prediction is bearish, with the next target being at $75,000. This price coincides with the 23.6% Fibonacci Retracement level.
However, a surge above this month's high of $82,553 will invalidate the bearish outlook as it will send a signal that there are still more bulls interested to push it higher.
Login to comment