Whipsawed Stock Market
Please click here for an enlarged chart of SPDR S&P 500 ETF Trust (NYSE:SPY) which represents the benchmark stock market index S&P 500 (SPX).
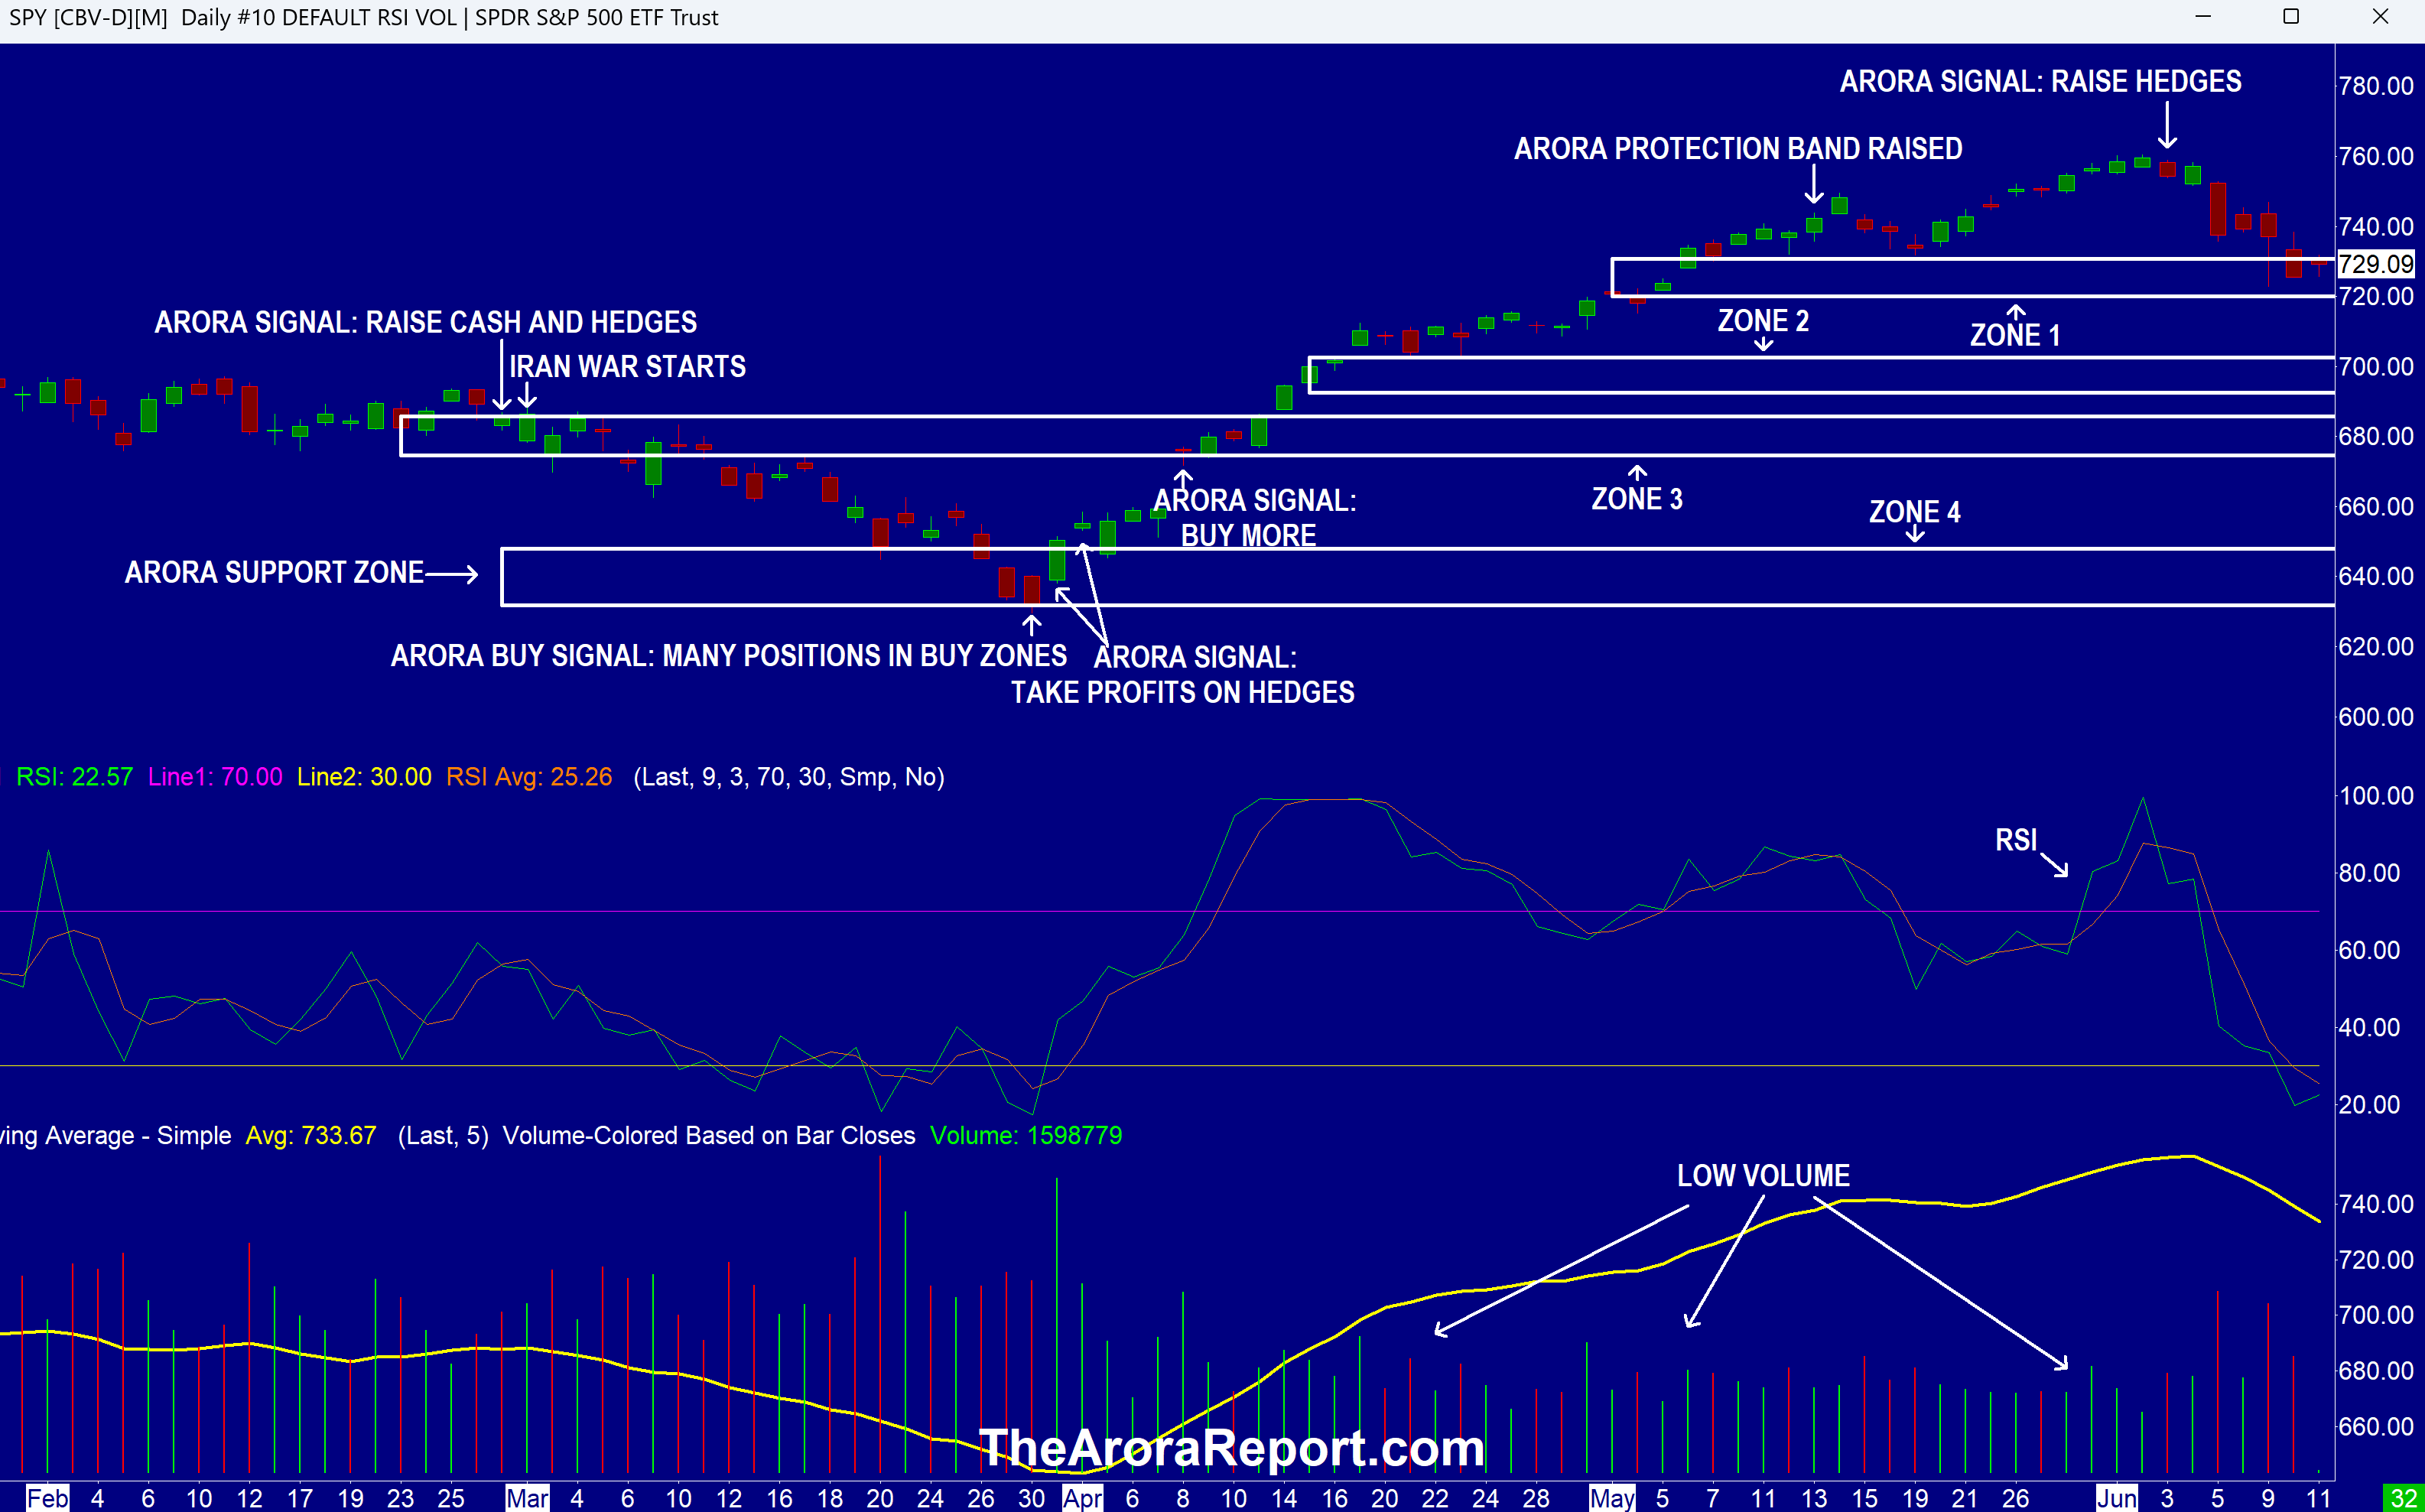
Note the following:
- The chart shows the stock market is in zone 1 (support).
- RSI on the chart shows the stock market is oversold. Oversold markets tend to bounce.
- If the stock market breaks below zone 1, zone 2 shown on the chart will be the next target.
- Earlier this morning, there was aggressive buying in stocks on President Trump's claim that top officials from Iran called him directly and begged for an end to the strikes. The statement came after the U.S. struck Iran hard with 49 Tomahawk missiles. In response, Iran fired on U.S. bases. Buying in the stock market continued even after Iran denied President Trump's claim. The buying in the stock market turned into selling a few minutes ago when President Trump said that the U.S. will hit Iran "very hard" tonight and at "some point" the U.S. "will be taking Kharg Island, and other oil infrastructure points, and assume total control of their oil and gas markets, much like we have with Venezuela."
- Oil had dropped on President Trump’s first statement, rose on President Trump's second statement, and is now pulling back again as of this writing.
- Producer Price Index (PPI) came hotter than expected. Here are the details:
- Headline PPI came at 1.1% vs. 0.7% consensus.
- Core PPI came at 0.4% vs. 0.4% consensus.
- Prudent investors should note that the prior PPI has been revised, and it was not as hot as originally released. Here are the details:
- Prior headline PPI revised to 1.1% from 1.4%.
- Prior core PPI revised to 0.7% from 1.0%.
- Retail investors have put in over $70B in orders for SpaceX (SPCX) stock. The total IPO is $75B. Additionally, there are apparently several over $10B each institutional orders. Keep in mind the foregoing numbers only indicate interest and are not firm orders. Investors will be firming up their orders tonight. As of this writing, on Hyperliquid, SpaceX stock is trading at $162.80 vs. $135 IPO price.
- Initial jobless claims came at 229K vs. 222K consensus.
European Central Bank Rate Hike
European Central Bank (ECB) raises its interest rate by 25 bps to 2.25%. This rate hike is inline with expectations. ECB has become the first major central bank to raise rates to contain inflation stemming from the Iran war. ECB is projecting 2026 inflation of 3.0% vs. prior 2.6%. ECB is projecting 2026 growth of 0.8% vs. prior 0.9%.
Magnificent Seven Money Flows
Most portfolios are now heavily concentrated in the Mag 7 stocks. For this reason, it is important to pay attention to early money flows in the Mag 7 stocks on a daily basis.
In the early trade, money flows are positive in Amazon.com, Inc. (NASDAQ:AMZN), NVIDIA Corp (NASDAQ:NVDA), Tesla Inc (NASDAQ:TSLA), and Apple Inc (NASDAQ:AAPL).
In the early trade, money flows are neutral in Alphabet Inc Class C (NASDAQ:GOOG) and Meta Platforms Inc (NASDAQ:META).
In the early trade, money flows are negative in Microsoft Corp (NASDAQ:MSFT).
In the early trade, money flows are positive in S&P 500 ETF (SPY) and Invesco QQQ Trust Series 1 (NASDAQ:QQQ).
Momo Crowd And Smart Money In Stocks
Investors can gain an edge by knowing money flows in SPY and QQQ. Investors can get a bigger edge by knowing when smart money is buying stocks, gold, and oil. The most popular ETF for gold is SPDR Gold Trust (GLD). The most popular ETF for silver is iShares Silver Trust (SLV). The most popular ETF for oil is United States Oil ETF (NYSE:USO).
Bitcoin
Bitcoin (CRYPTO: BTC) is range bound.
What To Do Now
Consider continuing to hold good, very long term, existing positions and add tactical positions based on signals.
The Arora Report is known for its accurate calls. The Arora Report correctly called the big artificial intelligence rally before anyone else, the new bull market of 2023, the bear market of 2022, new stock market highs right after the virus low in 2020, the virus drop in 2020, the DJIA rally to 30,000 when it was trading at 16,000, the start of a mega bull market in 2009, and the financial crash of 2008. Please click here to sign up for a free forever Generate Wealth Newsletter.
Benzinga Disclaimer: This article is from an unpaid external contributor. It does not represent Benzinga’s reporting and has not been edited for content or accuracy.
Login to comment