Market Positioning
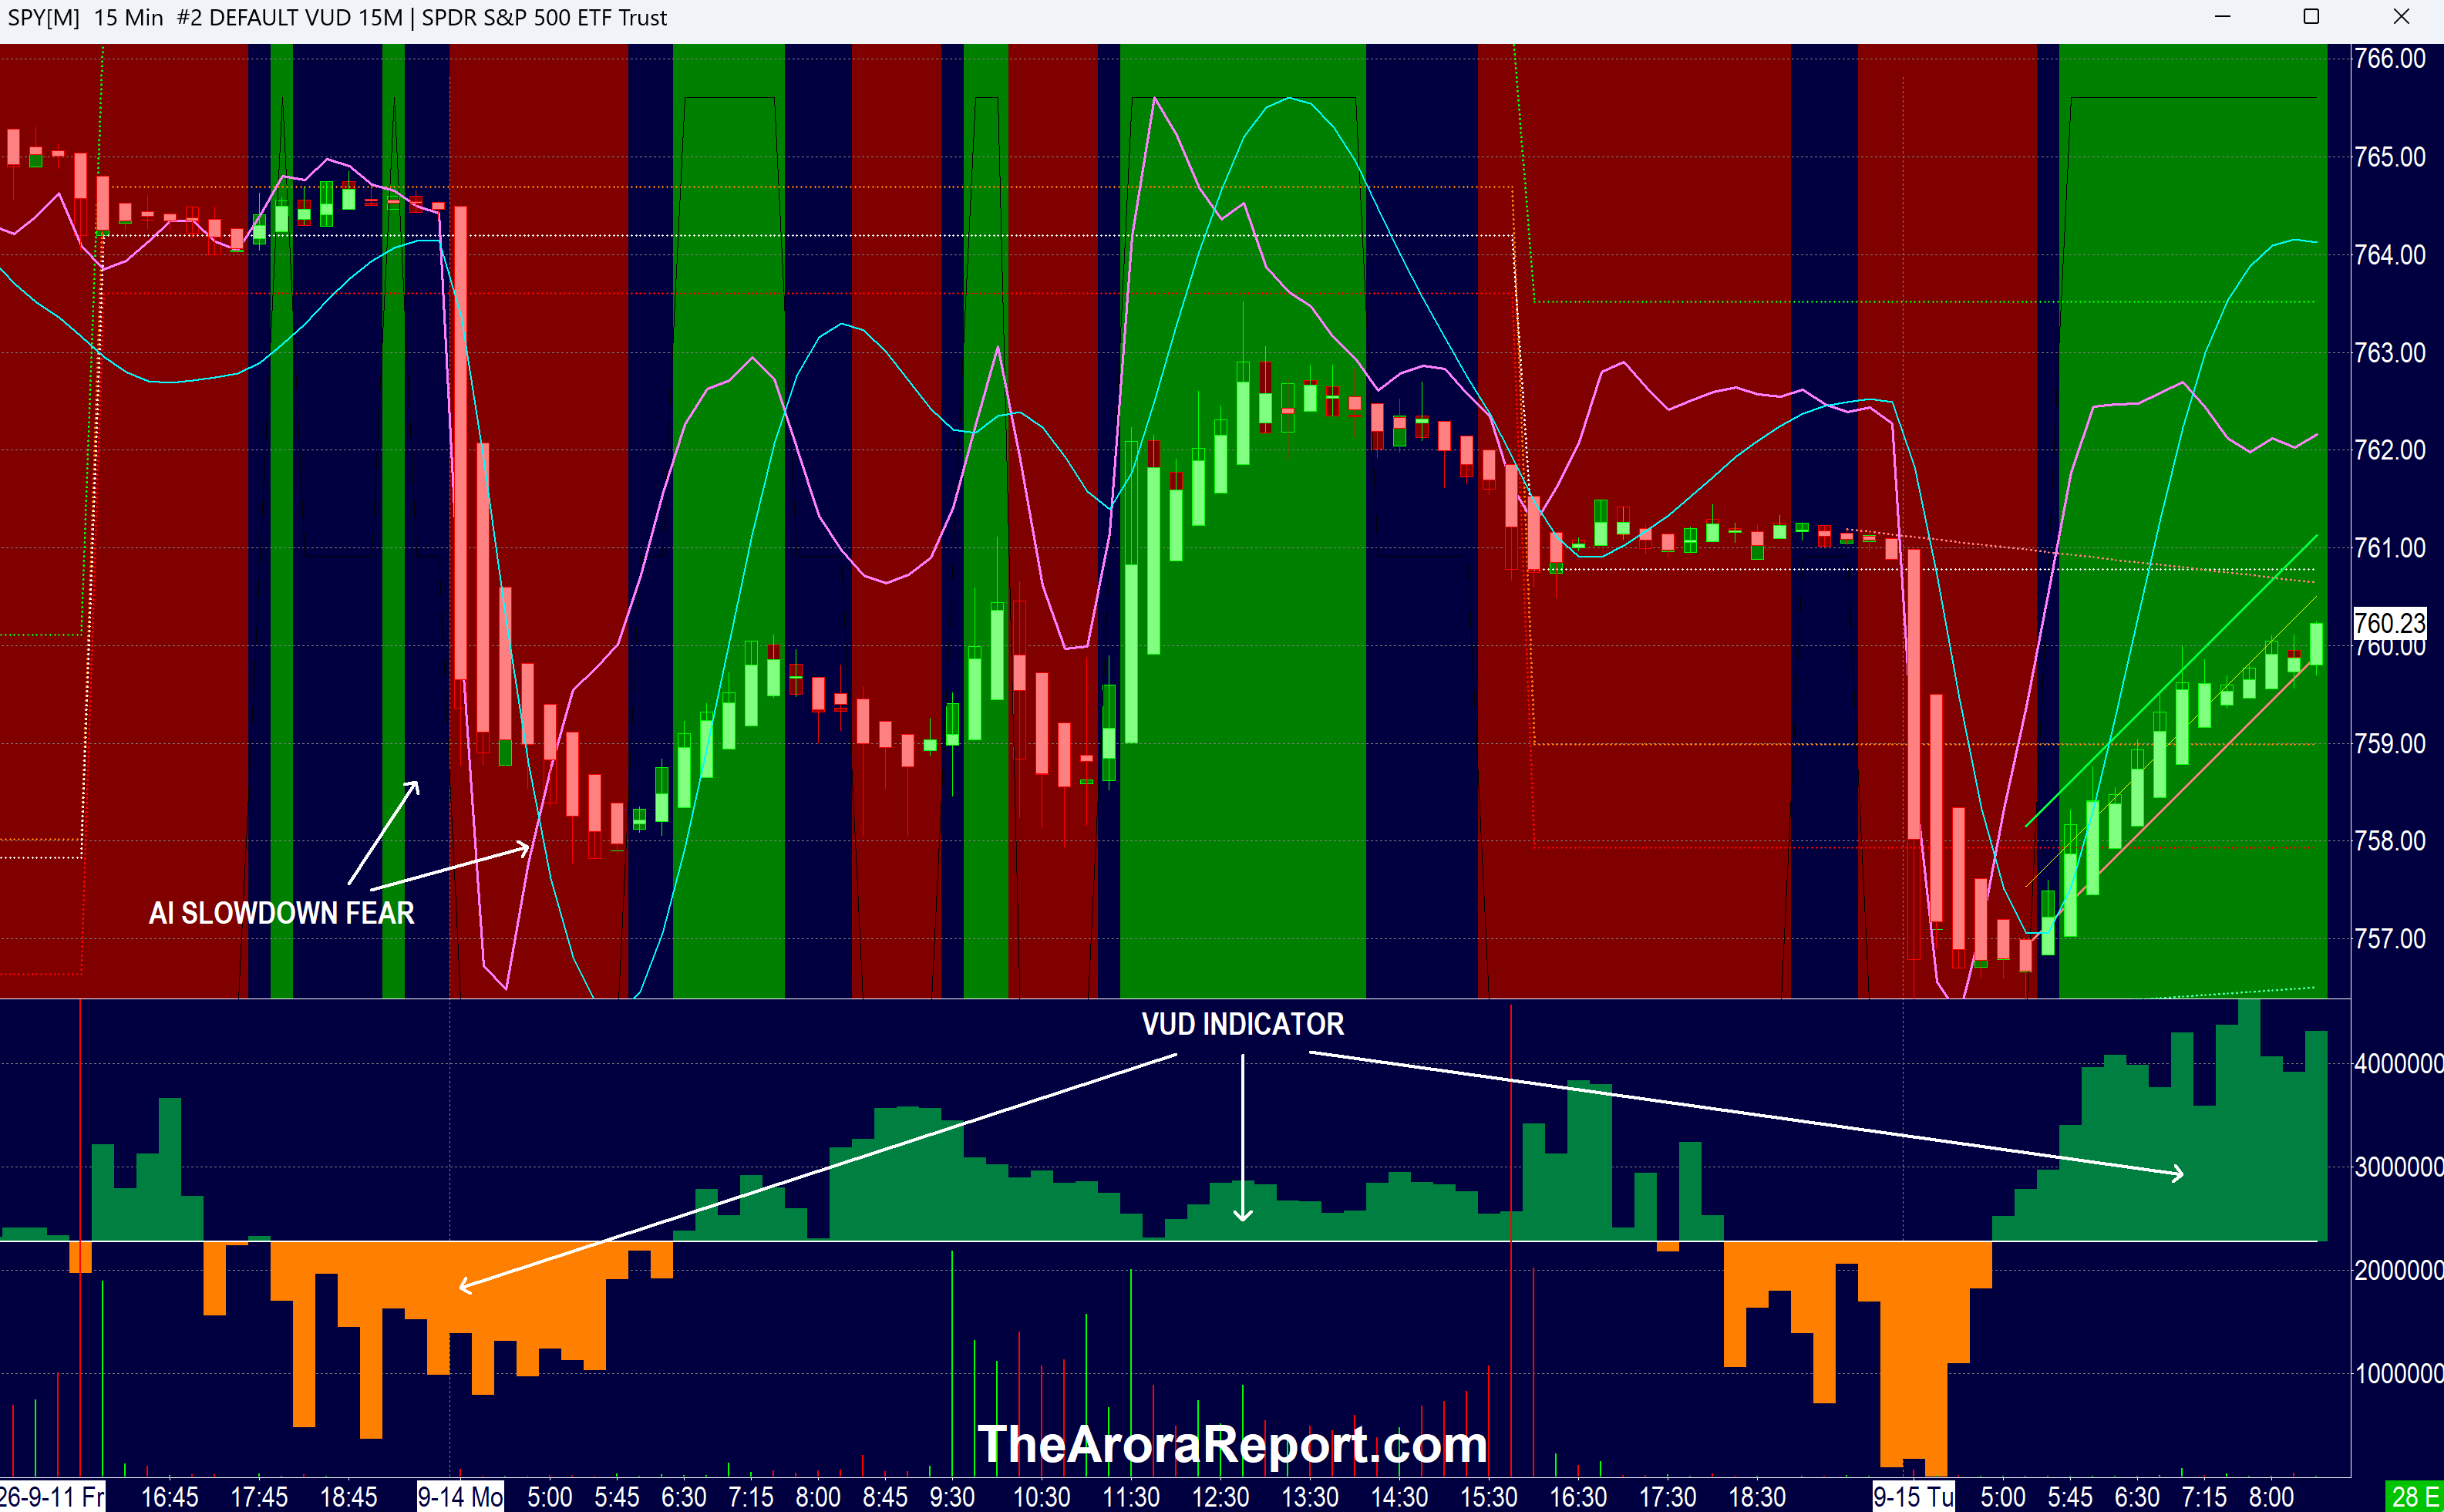
Please click here for an enlarged chart of SPDR S&P 500 ETF Trust (NYSE:SPY) which represents the benchmark stock market index S&P 500 (SPX).
Note the following:
- The chart is a 15 minute chart to illustrate the price action since three AI leaders advocated for an AI slowdown.
- The chart shows the initial drop on AI slowdown fears.
- The chart shows that the stock market rallied from the lows.
- The stock market rally was primarily driven by President Trump. President Trump acted on both fronts that were driving the stock market lower. One was AI fears, and the second was rising oil.
- On the AI front, President Trump rejected calls for slower AI development. President Trump emphasized that a slowdown could impact the U.S.’ position vs. China. At the All-In Summit, NVIDIA Corp (NASDAQ:NVDA) CEO Jensen Huang had President Trump on speaker phone live before the audience. President Trump said that those advocating for an AI slowdown were engaging in a "sick conspiracy."
- On the oil front, President Trump posted, "The failing nation of Iran wants to make a deal, quickly and badly. I will determine whether or not the USA will choose to engage – The concept of which we are open to.”
- As of this writing, the yield on 10 year Treasuries is hovering around 5%. This is the highest level since 2007. Here is the key question: Will the 10 year yield back off from here, or will it march toward 5.25%? In our analysis, the stock market is positioned for the yield to back off. The stock market is not prepared for the yield to rise to 5.25%.
- President Trump says the U.S. should have lower interest rates. The FOMC meeting starts today. The Fed’s rate decision will be announced tomorrow at 2pm ET. Fed fund futures are predicting a 92.5% probability of a rate hike. Here is the key question: Will the FOMC listen to President Trump? On the surface, the Fed will say it is independent.
- In our analysis, the hard data clearly establishes the need for the Fed to raise interest rates.
- Further in our analysis, an even more important question is how the markets will react to the Fed decision. There is no consensus. There is a fair probability that long end yields will come down and stocks will go up if the Fed raises rates as this will indicate that the Fed is being responsible. On the other hand, if the Fed does not raise rates, this will hurt the Fed’s reputation and will be negative in the long term. However, the momo crowd may aggressively buy stocks as the momo crowd is addicted to artificially low interest rates.
Magnificent Seven Money Flows
Most portfolios are now heavily concentrated in the Mag 7 stocks. For this reason, it is important to pay attention to early money flows in the Mag 7 stocks on a daily basis.
In the early trade, money flows are positive in Nvidia (NVDA).
In the early trade, money flows are neutral in Tesla Inc (TSLA).
In the early trade, money flows are negative in Apple Inc (NASDAQ:AAPL), Amazon.com, Inc. (NASDAQ:AMZN), Alphabet Inc Class C (NASDAQ:GOOG), Meta Platforms Inc (NASDAQ:META), and Microsoft Corp (NASDAQ:MSFT).
In the early trade, money flows are mixed in S&P 500 ETF (SPY) and Invesco QQQ Trust Series 1 (NASDAQ:QQQ).
Momo Crowd And Smart Money In Stocks
Investors can gain an edge by knowing money flows in SPY and QQQ. Investors can get a bigger edge by knowing when smart money is buying stocks, gold, and oil. The most popular ETF for gold is SPDR Gold Trust (GLD). The most popular ETF for silver is iShares Silver Trust (SLV). The most popular ETF for oil is United States Oil ETF (NYSE:USO).
Bitcoin
Bitcoin (CRYPTO: BTC) is range bound.
What To Do Now
Consider continuing to hold good, very long term, existing positions and add tactical positions based on signals.
The Arora Report is known for its accurate calls. The Arora Report correctly called the big artificial intelligence rally before anyone else, the new bull market of 2023, the bear market of 2022, new stock market highs right after the virus low in 2020, the virus drop in 2020, the DJIA rally to 30,000 when it was trading at 16,000, the start of a mega bull market in 2009, and the financial crash of 2008. Please click here to sign up for a free forever Generate Wealth Newsletter.
Benzinga Disclaimer: This article is from an unpaid external contributor. It does not represent Benzinga’s reporting and has not been edited for content or accuracy.
Login to comment