Take every stock that reported earnings this summer and ask one question: did it move as much as the options market said it would?
Most didn’t. That part is normal. Options usually price earnings a little rich, the way insurance costs a little more than the average claim. What’s not normal is by how much.
We measured every U.S. stock with listed options that reported from early July through mid-September, against its expected move: the size of move, up or down, that option prices imply for the report.
The season in one line: options asked about 22% more than in the same season last year. Stocks delivered about 4% more.
And graded stock by stock — each company against its own track record — stocks fell short of the moves priced for them by the widest margin since the 2022 bear market. “Expensive” in this piece means exactly that: the priced move showed up less often than usual. Pricing accuracy, not anyone’s profits.
Every Stock Against Its Own Record
The fairest way to grade a season isn’t to compare it with other seasons head-on. It’s to ask every stock how this season went against its own history, then average the grades. One stock, one grade — so it doesn’t matter which companies happened to report, or that a mega-cap clears its bar far more often than a small-cap.
The answer: these same stocks normally clear their expected move about 43 times in 100. This summer they managed about 37. Six in ten did worse than their own record.

Grade every reporting season since 2022 the same way and this one lands fourth from the bottom. The three below it all belong to the 2022 bear market.
It isn’t that stocks went quiet, either. The typical delivered move, 7.7%, was a touch bigger than last summer’s 7.4%. The asking price is what moved: the median expected move was 9.7%, up from 8.0%.
What Overpriced Looked Like
The extremes tell you the range. Dominion Energy Inc (NYSE:D) was priced for a ±4.7% move and moved 0.8%. Albertsons Companies Inc (NYSE:ACI) was priced for ±5.6% and fell as much as 24.5%. But the extremes are often smaller or thinly traded names, so here is the cleanest big-name example on each side.
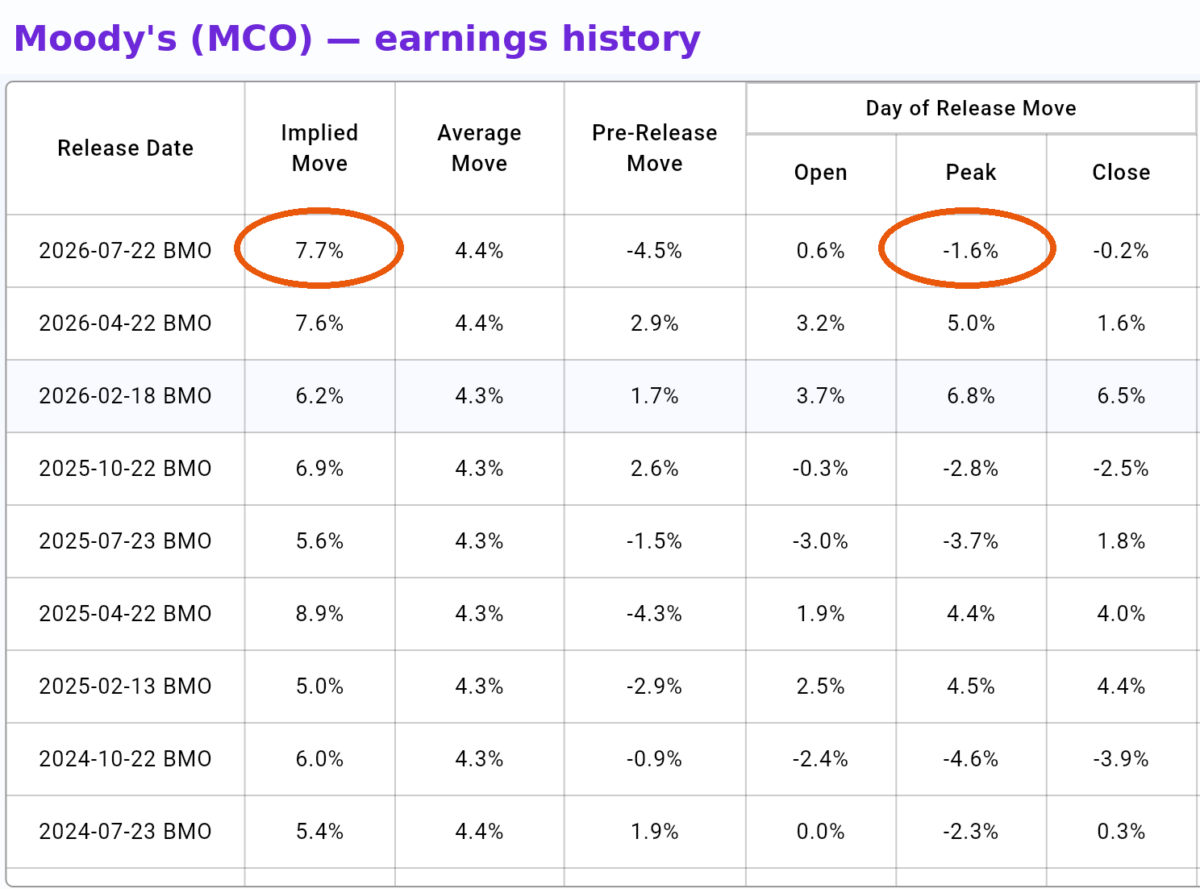
Moody’s Corp (NYSE:MCO) reported on July 22. Options priced a ±7.7% move — about 75% above the ±4.4% the stock has averaged on earnings. The stock’s biggest swing that day was 1.6%. It closed down 0.2%.
That trade — paying for drama and watching nothing happen — was the season’s signature. Big surprises were scarce: about one report in six beat its expected move by half again or more, against roughly one in five in a normal season.
Scarce, not absent. Salesforce Inc (NYSE:CRM) reported on August 26 with options pricing a ±7.2% move, in line with its usual earnings premium. The stock swung 23.8% at its peak and closed up 22.6% — more than triple what was priced, and its biggest earnings-day move since 2020.

Both stories live in every season. The report card is about the ratio between them, and this summer the Moody’s trade vastly outnumbered the Salesforce one.
The worst grade by sector went to financials. Banks and insurers cleared their expected move 23% of the time, against their own 35% norm — options were priced for mid-July drama that mostly never came.
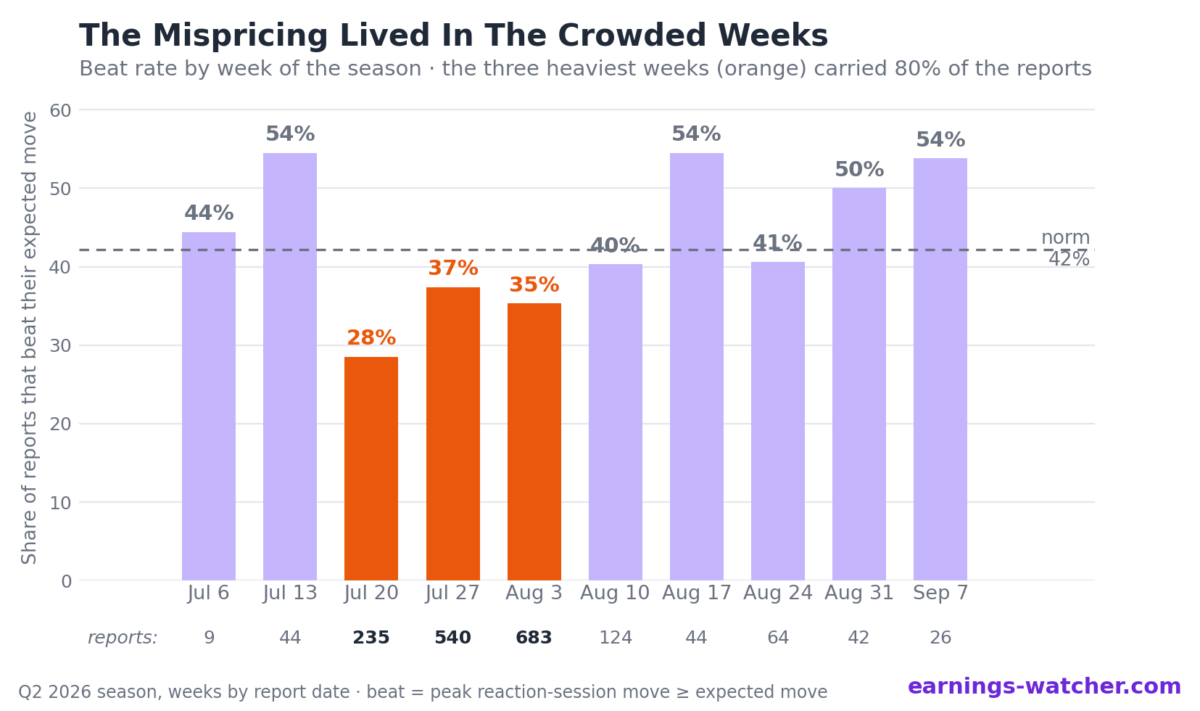
One more pattern: the worst weeks were the busiest ones. In the three peak weeks of the season — late July to early August, when more than 80% of the companies reported — only about a third of stocks covered their expected move. In the quiet weeks before and after, closer to half did.
Fewer companies report at the edges, so take that as a lean rather than a law — but it leaned the same way all summer.
A Calm Market Makes It Worse, Not Better
Here’s one of the cleanest patterns in the four years of earnings data before this season: the calmer the market, the better the odds a stock covers its expected move. VIX under 15 on the report date, stocks have cleared the bar 46% of the time.
Between 15 and 20, 44%. Above 25, only 35%. Fear raises the asking price — the median expected move climbs from 7.9% to 9.0% across those ranges — while what stocks actually deliver barely changes.

That chart is worth keeping for October. It’s also what makes this season strange.
Q2 2026 was calm. The VIX never closed above 21, and nearly 80% of the season’s reports landed in the 15–20 range — where stocks have historically cleared their bar 44% of the time. This season, in that same range, they cleared it 36%.
In a frightened market, overpriced options are no surprise — everyone pays up for protection, and the odds sink. That’s the staircase in the chart. This season broke the pattern: bull-market calm, and a bear-market miss. The only seasons that graded worse all sat with the VIX above 22, in the middle of the bear market.
What It Means For The Next Earnings Season
288 stocks — roughly one in six — blew through their expected move this summer by half again or more. Salesforce was one of them.
So far, options are charging them nothing extra for it. Their expected moves have drifted down about 7% since last quarter — right in line with stocks that did nothing surprising. But history says the markup comes: a stock that just shocked typically walks into its next report priced about 10% above its own norm (Options Remember Earnings Shocks) — a markup that is there the night before the print and, we now know, absent two months out.
So watch it build. Lam Research Corp (NASDAQ:LRCX) — priced 9.5% in July, moved 26.6% — reports around late October. Albertsons (5.6%, 24.5%) usually mid-October. Abercrombie & Fitch Co (NYSE:ANF) — 13.7%, and 41.9% at its peak — around late November. And Salesforce in early December.
One habit for October, then: treat every expected move as a claim to check — against the stock’s own record, and against the market’s mood. Last quarter the options market raised its prices 22% for 4% more movement, and it was wrong. It gets a new report card in October.
Data note: 1,811 earnings events with report dates July 6 – September 12, 2026 — every U.S. optionable stock over $5 with a usable options quote — inside a history of 37,790 events since 2022. Expected move = at-the-money straddle at the last close before the report, as a percent of the stock price; actual move = the reaction session’s biggest swing from the prior close (measured close-to-close instead, every verdict is unchanged). Season grades compare each stock with its own record across all other reporting seasons, and the results hold when restricted to stocks over $2 billion. Full methodology and figures in our wiki.
Author Disclosure: The author operates EarningsWatcher (earnings-watcher.com), the analytics platform whose data is referenced in this article. The author holds no positions in the securities mentioned.
Author Disclaimer: EarningsWatcher is a publisher, not a registered broker-dealer or investment advisor. The information in this article is for informational and educational purposes only and should not be considered personalized investment advice.
Image credit: Author
Benzinga Disclaimer: This article is from an unpaid external contributor. It does not represent Benzinga’s reporting and has not been edited for content or accuracy.
Login to comment